Salesloft Coaching is a series of dashboards that track goals and compare rep performance across a group or team. With this capability, managers and reps can collaborate and identify areas for improvement and then develop personalized plans for each seller to accelerate their sales.
The Coaching dashboards are designed to show how well a seller is performing key actions like emails, calls, and meetings. By reviewing the dashboards, teams can accomplish the following:
- Reps can identify and self-correct on key activities in comparison to their teams.
- Managers get a glimpse of how reps are progressing towards overall goals (who’s falling behind and may need more coaching).
- Managers can set, update, or remove goals for individual reps or multiple reps at once.
- Managers can review activities so they can coach reps on better prospecting techniques or objection handling.
Coaching is accessible to all Salesloft users by default, however, visibility within Coaching depends on the permissions assigned to your user role.
Users without admin permissions can see their own data inside of Coaching. This includes goal progress, trends, and more.
Default Admin roles come with more granular permissions that enable them to view team-wide data. These permissions include:
- Team View: See data in Coaching for individual users that are in the same group or hierarchy. The permission enables the group data in the Team Coaching Dashboard, access to the Individuals Coaching List View, and the User filter on the Individual View pages.
- Things to Note:
- If your team does not have groups set up, the Team View permission will show the data for all users in your team.
- If you want to make sure your reps cannot see other team members’ data, disable the Team View permissions. Users without the Team View permission will go directly to their Individual Coaching Dashboard when they access Coaching. They cannot see the Individual Coaching List View, the user filter on the Individual Coaching Dashboard, the group filter on the Team Coaching Dashboard, or data of other groups or users (other than themselves).
- Manage Goals: Allows access to the Goals Settings page. This permission controls managing other users’ and group goals beyond your own. By default, all users can edit their own goals.
- View Email Content: Shows the full email body when viewing an Email inside Coaching.
Admin Setup
In order to make sure your team’s data populates the Coaching dashboards, a team admin will need to configure specific settings inside of Salesloft. Click the following links for additional instructions about the settings to set up for Coaching:
- Configure Calendar Sync: When scheduling and rescheduling meetings, you want your calendar to be as up-to-date as possible. That’s where Calendar Sync comes in handy.
- Configuring Calendar Sync is essential for tracking meeting metrics which appear in the Meetings Booked panel and relevant charts.
- Each user manages their own Calendar Sync setting. Have each user Set Up Calendar Sync so their meeting data appears in the Coaching.
- Configure Opportunity Sync: To track your team’s opportunity metrics, you will need to configure Opportunity Sync. Opportunity Sync allows for the mapping of Opportunity field data. When Opportunity Sync is enabled, your Coaching Dashboard will be able to show Opportunity specific information like Opportunities Created.
- Configure CRM Sync (Deals Users): To track Deals metrics (such as Closed Won and New Pipeline Added) in Coaching , team admins must configure CRM Sync from their Deals Admin Settings.
- Things to Note: Only users who have been assigned the Admin role AND access to Deals can access these settings.
User Setup
To ensure meeting data appears in Coaching, each user must Set Up Calendar Sync.
To access Coaching, hover over Workspace in the top navigation panel. When the dropdown menu appears, select Coaching.
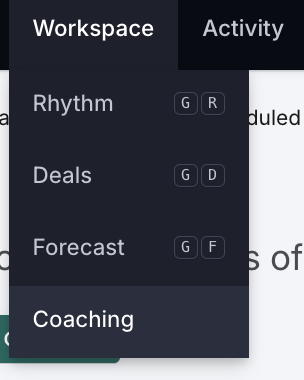
Figure 1: Navigate to Coaching Page from the top Navigation Bar
Inside Coaching, you will find page tabs for specific coaching tools. The tabs displayed and pages will vary based on your user permissions.
Coaching includes the following tool tabs:
The Team tab surfaces key outcome metrics throughout the sales lifecycle, from prospecting to closing. This view helps front-line managers understand their team's performance against set goals so you can discover areas for improvement and delve into additional coaching.
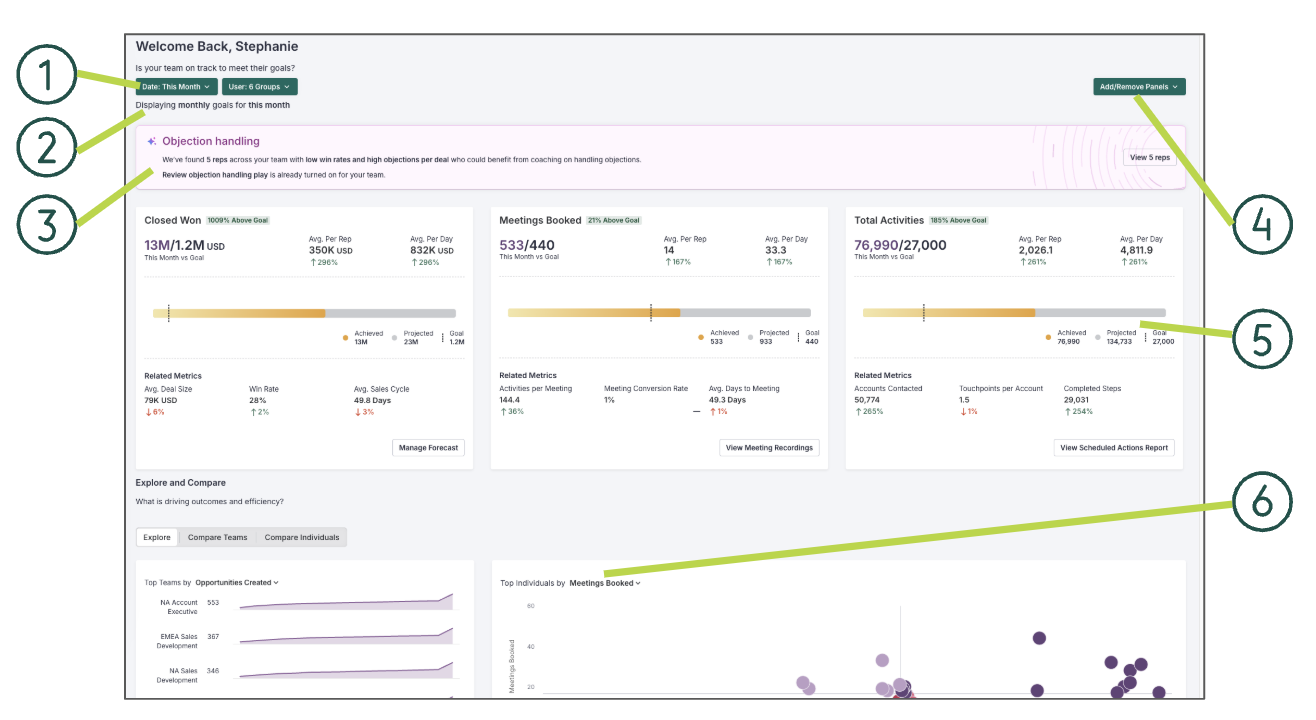
Figure 2: Example: Team Coaching Page
Let’s walk through what’s included in the Team Coaching page layout:
- Filters: You can use filters to change how information is displayed on the dashboard.
- Date range: The selected date range affects the metric, percent change, and goals displayed.
- Things to Note:
- Fiscal Quarter/Year is determined by CRM sync settings for Salesforce connected users only.
- Be sure that fiscal year settings are correct before the CRM is synced. Fiscal year settings will not be updated after the first sync.
- Weekends are included by default.
- The metrics shown are based on the user’s time zone.
- Group: By default, each user will only see their own group and sub-groups under their hierarchy.
- Things to Note:
- The Group filter is only visible to users with the Coaching Team View permission enabled.
- Teams without groups set up will not see the group filter and all other metrics will be calculated based on all users with data.
- Display Details: This display changes when you change the date range filter. For example, “Displaying monthly goals for this month” is based on the “Date: This Month” range selection.
- AI Insight: Agents that identify gaps and areas of opportunity within the sales funnel based on customer-specific historical data analysis.
- Add/Remove Panels: Allows you to select and order (by drag and drop) which Goal Panels are shown on the Team dashboard.
-
- Things to Note: Only three panels can be displayed at a time.
- Goal Panels: Panels that show how your team is tracking towards specific goals. You can select up to 3 goals to be displayed. Let’s walk through the components of a Goal Panel.
- Panel Name
- Percentage of Goal: The percent above or below the goal achieved.
- Time Period vs Goal: The outcome metric compared to the goal for that metric for the selected date range and the selected groups.
- Average Per Rep: The average outcome achieved per rep (users in the selected groups) and the percent change from the previous period.
- Average Per Day: The average outcome achieved per day in the selected date range and the percent change from the previous period.
- Outcome Chart: A chart showing the outcome achieved, the goal, and the projected outcome at the end of the current period. Managers can use this to assess whether the team is projected to hit their goals. The projected total only appears when This Week/Month/Quarter/Year is selected in the date filter.
- Purple Bar: Color of the bar in the chart while a goal is in progress or behind.
- Gold Bar: Bar color when the goal is met or exceeded. Way to go!
- Related Metrics: Up to three related metrics and their percent change from the previous period.
- View (more): A button link to a relevant part of the platform for further exploration. This will vary based on the panel.
- Explore and Compare: This section breaks down the factors that drive outcomes and efficiency.
- Explore: The Explore tab uses charts inside panels that show how your team and reps are progressing on specific goals and outcomes.
- Top Teams: Shows how the groups across your team are performing in relation to a specific goal metric. This chart should be used to compare groups based on the highest total outcomes.
- Top Individuals: Compare the efforts of the members of your team.
- Contact Conversation Funnel: Reveals how successful your team’s prospecting efforts are throughout the entire overall sales process.
- Compare Teams: A table view that compares each group on your team with the highest total outcomes.
- Compare Individuals: A table view that shows individual rep progress on goals and allows you to compare outcome results across reps.
When you click the Individual tab, Salesloft admin and users with the Team View permission will land on the Individual List View. The Individual List View shows users on your team and their progress towards certain goals. You can use the Individual List View to see how your team is tracking towards goals, identify areas of concern, and celebrate accomplishments.
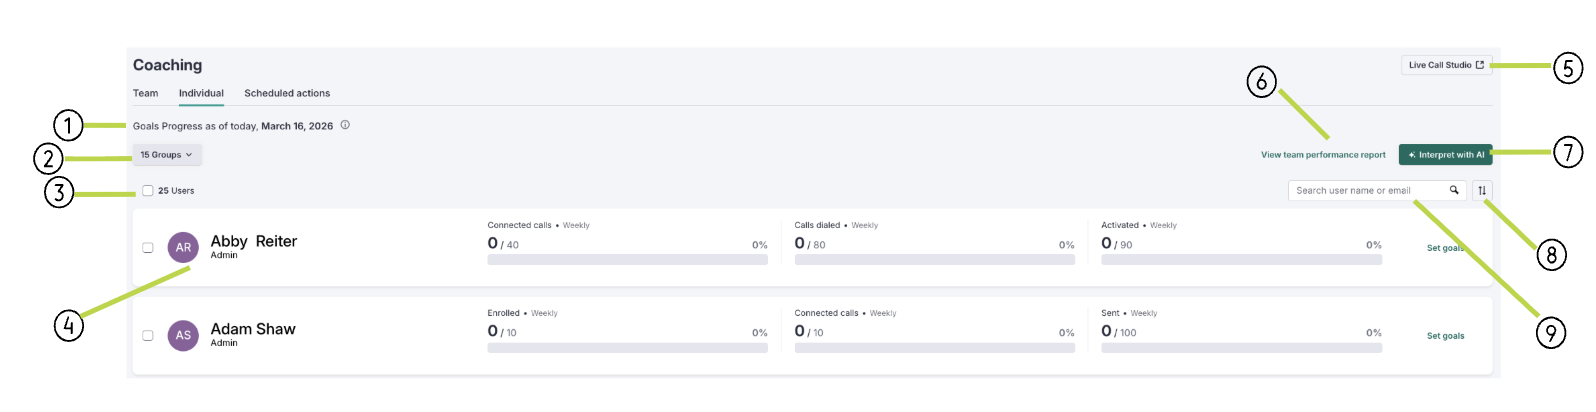
Figure 3: Example: Coaching Individual List - Manager View
Let’s walk through the components of the Coaching Individual List View:
- Goal Progress as of (Date): (Goal Progress Header) Lets you know the time frame when the goal information for your team has been gathered. The goals time frames are selected when you set the goals for your team.
- Things to Note: Weekly goals are calculated from the start of the week (Monday) until the current day. Monthly goals accumulate from the start of the month (day 1) until the current day.
- Group Filter: A filter to select one or more groups. By default, the Coaching Team View will show the group that you are assigned to and the list of users also assigned to that group.
- Total number of users: Shows the total number of users
- Individual Goals List View: (AKA List of Goal Progress Tiles) The bulk of the Coaching Individuals View Page shows your team's progress inside the Goal Progress Tiles. The tiles listed show the set goals and a visual indicator of progress towards those goals of users in the selected group(s). Team members will be listed in alphabetical order.
- Live Call Studio: Directs you to the Live Call Studio where you can listen to active outbound calls.
- View Team Performance Report: A link to a filtered Team performance report pre-filtered to the same group. While the Coaching Team View highlights goals and drives coaching conversations, the Team Report offers a detailed look at all of the activities logged by the members of the group.
- Interpret with AI: Opens the Interpret with AI panel that generates a summary of your data.
- Sort: The Sort icon allows you to filter the Individual Goals List View by a user’s First Name, Group, Role.
- Search: Search for a specific user by their First Name, Role, or Group.
The Goal Progress tile shows the Coaching metrics for each user. The Team View offers a list of Goal Progress Tiles for all of the users in a group. When you visit an individual’s Coaching view, the Goal Progress tile appears at the top of the page as the header to let you know whose Coaching data you are viewing.

Figure 4: Example: Goal Progress Tile
Users have their own tile where you can view the Coaching-specific information. Let’s walk through a Goal Progress tile.
- Checkbox: Select multiple users to change goal settings in bulk.
- User’s Name: Name of the Salesloft user.
- Goals: Overview of the Goal that has been defined by a manager or admin for this user. User's can have anywhere from 0-3 goals.
- Goal Type: Metric being measured for that particular goal.
- Time Frame: How often the goal is measured.
- Number completed out of projected goal amount
- Percentage of goal achieved
- Progress indicator bar
- Set Goals: Edit the goals assigned for this user.
- Things to Note: Goals edited using this Set Goals option will also update the Goal Settings. This button will only appear when the Manage Goals permission is enabled.
When non-admin users click the Individual tab, you will land on the the Individual Coaching Dashboard. Salesloft admin and users with the Team View permission can click a user on the Individual List View to see this dashboard. The Individual Coaching Dashboard is an overall look into activities and outcomes for an individual seller.
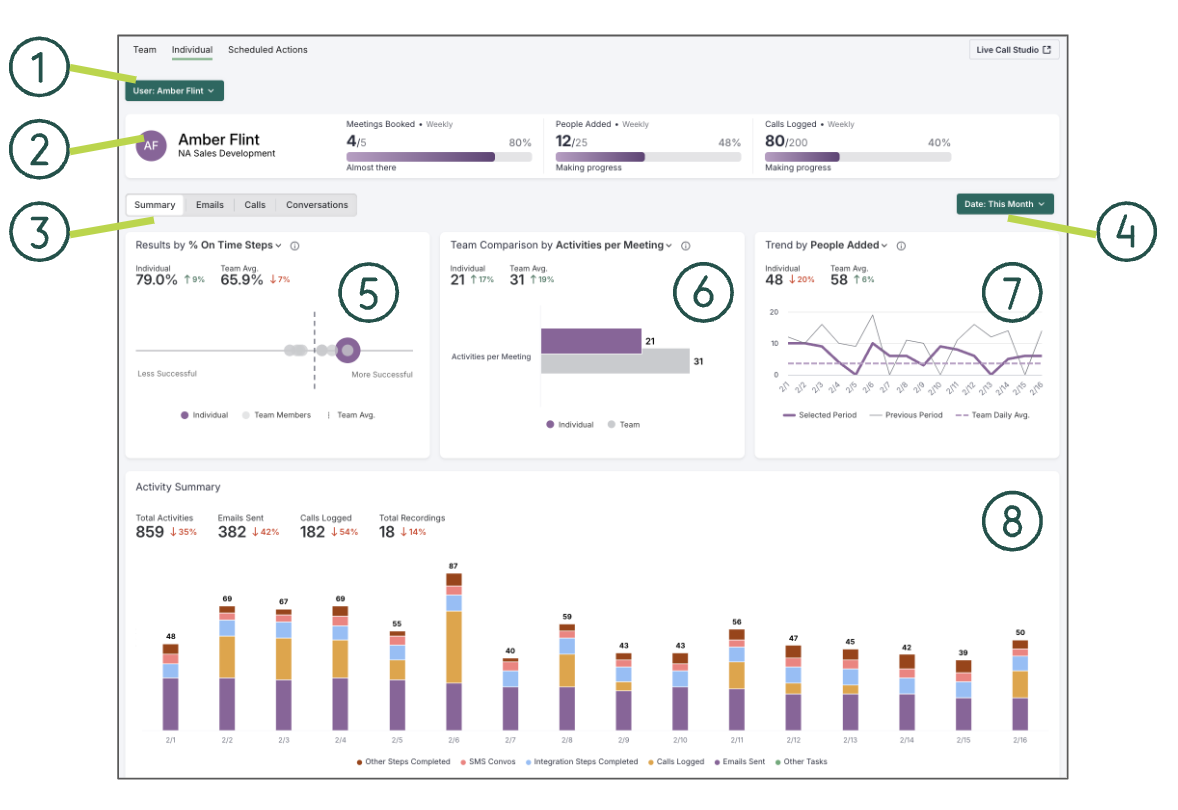
Figure 5: Example: Individual Coaching Dashboard
Let’s walk through the Individual Coaching Dashboard so you understand what information you can find there:
- User Filter: Allows a manager to shift between the different users on their team.
- Things to Note: This filter will only appear when the Team View permission is enabled.
- Goal Progress Tile: The user’s goal progress. Use the goal progress tile to decide which area may need special attention. For example, if you are tracking calls logged, you can leverage the Individual Coaching Call tab.
- Individual Coaching Tabs: The Dashboard is separated into different tabs that show metrics dashboards and panels related to a specific subject matter or activity type. The tabs include:
- Individual Coaching Summary (Default Individual view)
- Individual Coaching Emails
- Individual Coaching Calls
- Individual Coaching Conversations
- Panel Filters: The filters that set the parameters for the data found in the Individual Coaching Dashboard Panels. Each Individual Coaching Tab includes the Date filter. The Conversations tab also includes a Recordings filter where you can view All Recordings or only Recordings where the user was the organizer.
- Results Panel: A dot plot that compares different types of results between the individual rep and their peers. Using this chart, you can gauge whether the rep is more or less successful than the rest of the team when it comes to achieving results.
- Top Keywords: Panel found in the Individual Coaching Conversations tab.
- Team Comparison: A bar chart that compares an individual rep’s outcomes to the team average. Using this chart, you can gauge if the rep is as efficient as the rest of the team.
- Trend: A line chart that shows quantitative data. Using this chart, you can see the number of and activity accomplished by the rep, and whether those numbers are trending upwards or downwards from the previous time period and that of their peers.
The Individual Coaching Summary provides a visual representation of the rep’s overall performance. Use this page to guide the conversation in a 1-1. Includes the following charts:
Things to Note: Comparative data found on the summary page will show the user’s individual metric compared to the group average.
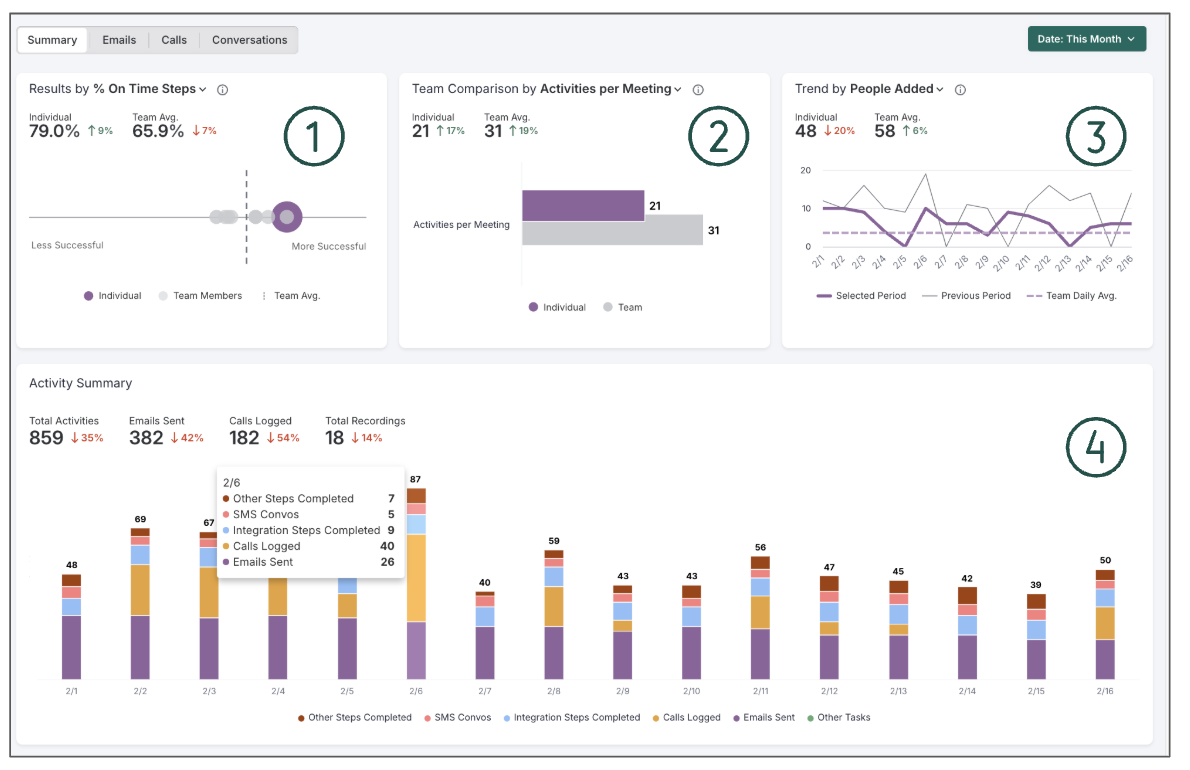
Figure 6: Example: Individual Coaching Summary
Inside the Individual Coaching Summary, you'll find:
- Coaching Summary Page’s Results By Panel: The Results By Panel offers metrics that offer insight into where does this rep stand on this metric relative to their peers.
- Coaching Summary Page’s Team Comparison Panel: The Team Comparison By Panel on the Summary page offers metrics that can be used to see if a rep above or below the team’s average on this metric.
- Coaching Summary Page’s Trend Panel: The Trend Panel on the Coaching Summary page provides insight into if the seller is trending up or down on this metric or did something change at a specific time point?
- Activity Summary Panel: Overview of the activities the rep has completed. Within Coaching, the Activity Summary can confirm whether the number of actions meets expectations. Below the primary metrics, a stacked bar chart will show the total activities completed per day in the given time period. Hover over a metric name to only view that type of activity in the stacked chart.
Individual Coaching Emails tab is where managers and reps can focus on Email performance. The charts and panels include:
Things to Note: Coaching Email data is gathered from emails sent using Salesloft, or Lofted, whether that be directly from the Salesloft app or extension.
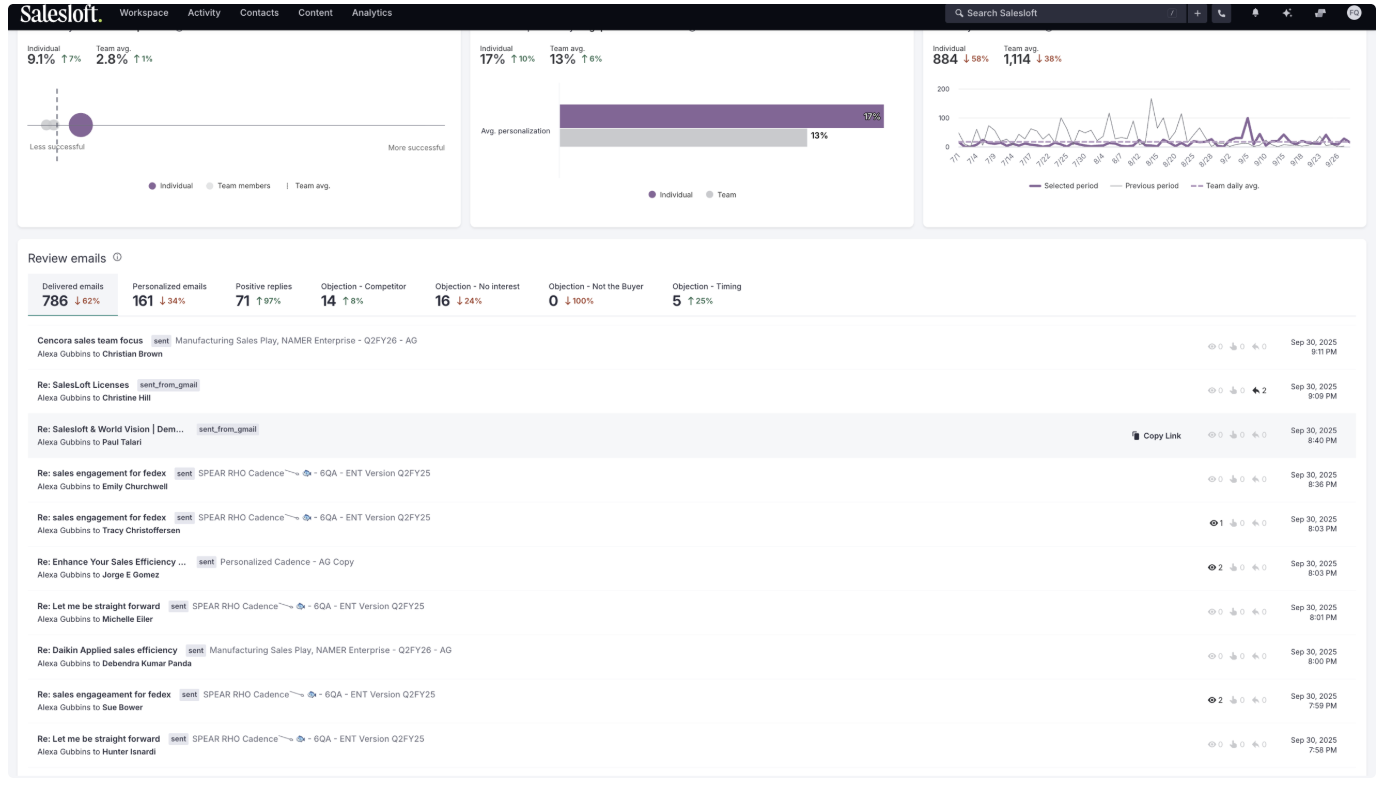
Figure 7: Example: Individual Coaching Emails
Inside the Individual Coaching Email Summary, you'll find:
- Coaching Emails Results By Panel: The Results By Panel shows if the seller is adhering to the email best practices.
- Coaching Emails Team Comparison Panel: The Team Comparison By Panel on the Summary page offers metrics that provide insight into what kind of personalization the seller doing.
- Coaching Emails Trend Panel: The Trend Panel on the Coaching Emails page offers metrics that provide insight into if the seller is responding to replies appropriately and in a timely manner.
- Coaching Review Emails Panel: The Review Emails Panel on the Coaching Emails page allows you to drill into emails. This panel is perfect for getting an in depth look into the specific types of emails the rep is sending.
The Individual Coaching calls tab is where managers and reps can focus on call performance. The charts and panels in Coaching Calls include the following:
Things to Note: Coaching Call data is gathered from calls made and logged using the Salesloft Dialer.
Figure 8: Example: Individual Coaching Calls
Inside the Individual Coaching Calls Summary, you'll find:
- Coaching Calls Results By Panel: The Coaching Calls Results By Panel provides insight into how your reps performing on their calls.
- Coaching Calls Team Comparison Panel: The Coaching Calls Team Comparison Panel gives you insight into how your teams are performing on their calls.
- Coaching Calls Trend Panel: The Coaching Calls Trend Panel provides insight into if the seller is trending up or down on their call metrics.
- Coaching Review Calls Panel: The Review Calls Panel on the Coaching Calls page allows you to drill into calls made by the rep. This panel is perfect for getting an in depth look into the specific types of calls the rep is making.
The Individual Coaching Conversations tab is where managers and reps can focus on how well a rep is running recording meetings.
Things to Note:
- Recordings are gathered from Salesloft Conversations.
- The following recordings are not included in Coaching recordings because they do not include active speaker detection:
- Dialer Calls: To coach calls made using the Salesloft Dialer, use the Coaching Calls page.
- Google Meet
- Manually uploaded recordings
- Recordings from bots
- Team averages calculated in Coaching Conversations are pulled from the data of everyone in your Salesloft team. This is different from the other pages in Coaching that pull averages from the Group.
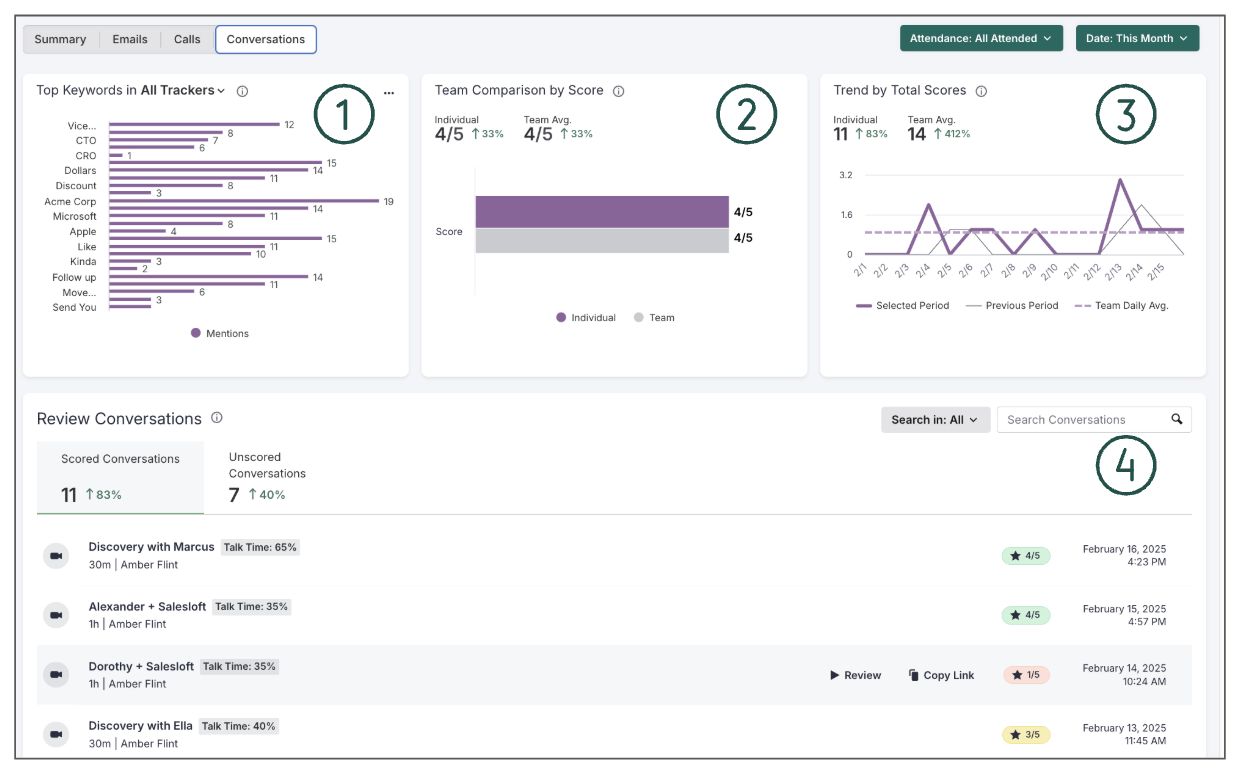
Figure 9: Example: Individual Coaching Conversations
The Coaching Conversations tab includes the following panels and charts:
- Top Keywords in Tracker Groups Panel: The Tracker Groups panel allows you to view the top 10 most frequently used Trackers, or keywords/phrases, within a selected date range. Trackers are collections of words and phrases that help you and your team identify phrase patterns during calls.
- Coaching Conversations Team Comparison Panel: The Team Comparison By panel on the Summary page focuses on efficiency and compares the individual to their team average.
- Trend by Total Scores Panel: The Trends by Total Scores panel is a line chart that focuses on volume and compares the performance of the current to the previous time period
- Coaching Review Conversations Panel: The Review Conversations Panel on the Coaching Recordings page allows you to drill into meetings attended by the rep. Here is where you can view both scored and un-scored conversations and initiate scorecard reviews from within each conversation. This panel is perfect for understanding how your sellers are interacting with prospects or customers. You can even find coachable moments by using the search bar to hone in on specific keywords or phrases mentioned by the rep or the buyer.