The Team Coaching Dashboard highlights the goals and results that stem from your team’s activities. It helps front-line managers understand their team's performance against set goals so you can discover areas for improvement and delve into additional coaching.
Speaking of coaching, the Team Dashboard can be found by hovering over Workspace in the Salesloft top menu. A dropdown menu will appear. Select Coaching. Managers and users with the Team View permission enabled will go directly to the Team Coaching Dashboard whenever they access Coaching – making it the Coaching homepage for managers.
Things to Note: Users who do NOT have the Team View permission enabled (including the default user role) will see their Individual Coaching Dashboard whenever they access Coaching. These users can view the Team dashboard by selecting the Team tab inside Coaching. Users with this permission set will only see their data and their assigned groups data in the Team Dashboard.
The Team Coaching Dashboard presents a series of result-centric panels that surface key outcome metrics throughout the sales lifecycle, from prospecting to closing.
In this article, we will walk through what’s included on the Team Coaching Dashboard:
The Team tab inside Coaching shows how your group is progressing towards specific goals. From the Team tab, you can select different filters and options that adjust the view on the page. Regardless of the view, the Team Coaching page includes a lot of data that can help managers and team members pinpoint areas for improvement as well as celebrate collective successes.
Let’s walk through what’s included in the Team Coaching page layout:
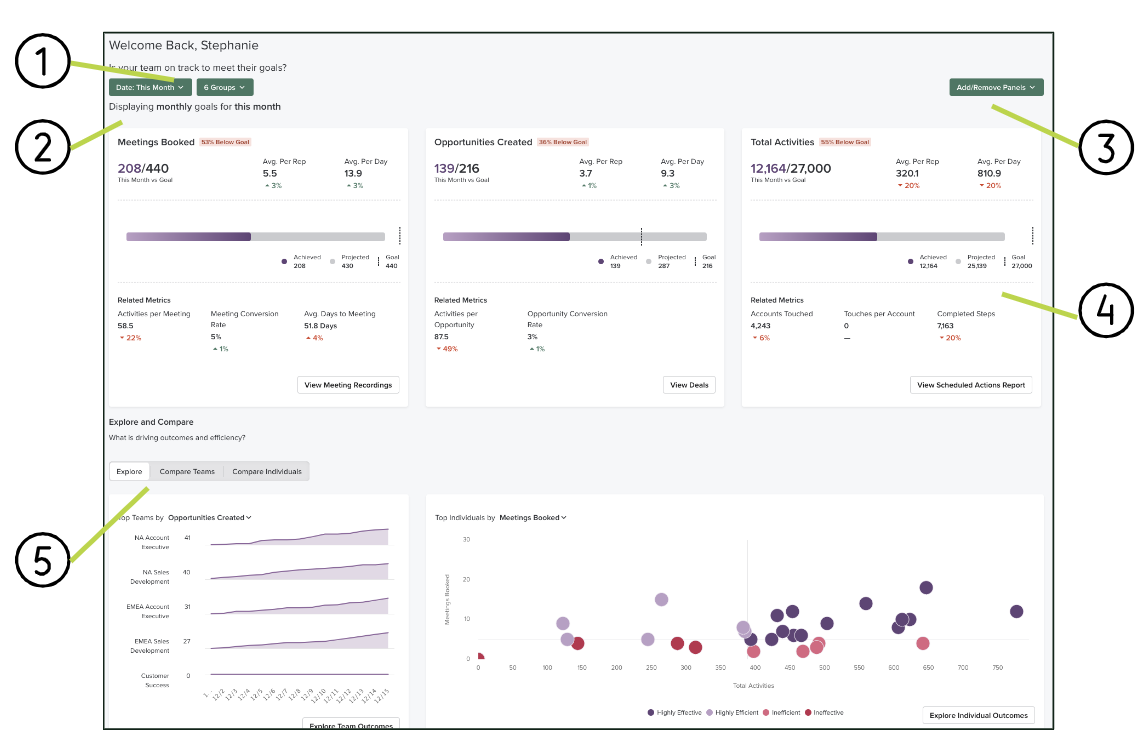
-
Filters: You can use these filters to change how information is displayed on the dashboard.
- Date range: The selected date range affects the metric, percent change, and goals displayed.
- Things to Note:
- Fiscal Quarter/Year is determined by CRM sync settings for Salesforce connected users only.
- Be sure that fiscal year settings are correct before the CRM is synced. Fiscal year settings will not be updated after the first sync.
- Weekends are included by default.
- The metrics shown are based on the user’s time zone.
- Group: By default, each user will only see their own group and sub-groups under their hierarchy.
- Things to Note:
- The Group filter is only visible to users with the Coaching Team View permission enabled.
- Teams without groups set up will not see the group filter and all other metrics will be calculated based on all users with data.
-
Display Details: This display changes when you change the date range filter. For example, “Displaying monthly goals for this month” is based on the “Date: This Month” range selection.
-
Add/Remove Panels: Allows you to select and order (by drag and drop) which Goal Panels are shown on the Team dashboard.
-
Goal Panels: Panels that show how your team is tracking towards specific goals. You can select up to 3 goals to be displayed.
-
Explore and Compare: This section breaks down the factors that drive outcomes and efficiency.
-
- Explore: The Explore tab uses charts inside panels that show how your team and reps are progressing on specific goals and outcomes.
- Compare Teams: A table view that compares each group on your team with the highest total outcomes.
- Compare Individuals: A table view that shows individual rep progress on goals and allows you to compare outcome results across reps.
The Goals Panels found on the Team Coaching Dashboard are visual representations of how your team is progressing towards their goals. The information shown in the panel is intended to help quickly spot which goals are on track and which are at risk.
Your team’s goals can be set up by a team admin from various locations in Salesloft, like the Goal Settings, the Compare Teams tab, or the Coaching Individuals page by a team admin. Once that is complete, the assigned goals for the team will appear. For example, let’s say you determine in your Goal Settings that your SDR team needs to book 20 meetings a week, create 10 opportunities, and complete 20,000 activities. Inside the Team Coaching dashboard, you can filter to see your SDR team with the Date filter This Week, and set the Goals Panel to view Meetings Booked, Opportunities Created, and Total Activities. Now, you can get a comprehensive view of how your SDR team is tracking on these important metrics.
While the metric and the data seen in each panel is different, every panel contains the same elements.
Let’s walk through the components of a Goal Panel. For more information about the metrics covered inside each Goal Panel, check out Select Your Team Coaching Goal Panels.
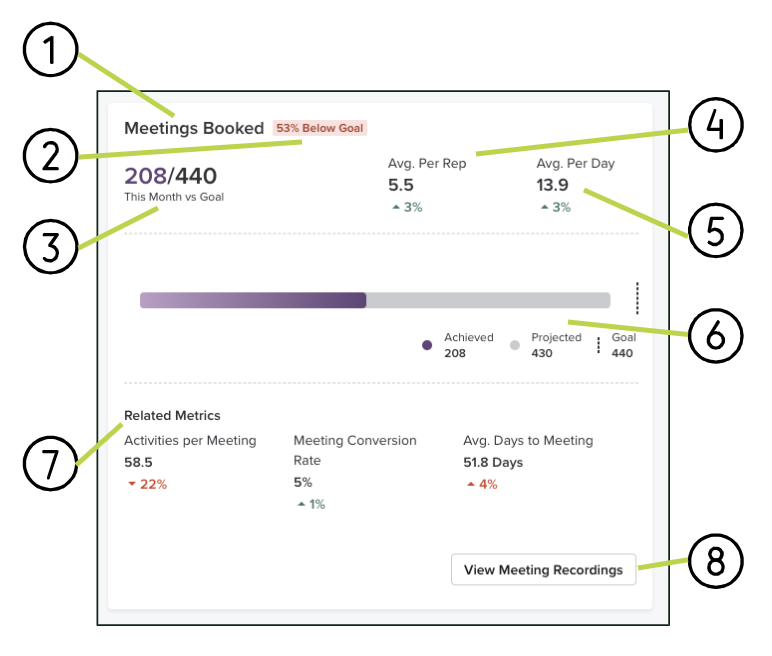
-
Panel Name
-
Percentage of Goal: The percent above or below the goal achieved.
-
Time Period vs Goal: The outcome metric compared to the goal for that metric for the selected date range and the selected groups.
-
Average Per Rep: The average outcome achieved per rep (users in the selected groups) and the percent change from the previous period.
-
Average Per Day: The average outcome achieved per day in the selected date range and the percent change from the previous period.
-
Outcome Chart: A chart showing the outcome achieved, the goal, and the projected outcome at the end of the current period. Managers can use this to assess whether the team is projected to hit their goals. The projected total only appears when This Week/Month/Quarter/Year is selected in the date filter.
-
Related Metrics: Up to three related metrics and their percent change from the previous period.
-
View (more): A button link to a relevant part of the platform for further exploration. This will vary based on the panel.
The Goals Panels take a holistic approach to your key metrics that are ideal for coaching an individual team and team members. However, there are times when it is beneficial to look beyond your specific team and understand how everyone else is performing. Whether you have competitive initiatives or you’re considering strategy across the organization, you can leverage the Explore and Compare charts to broaden your understanding of goals at your company.
The Explore and Compare section of the Team Coaching Dashboard includes three tabs – Explore, Compare Teams, and Compare Individuals. We will walk through each tab, starting with Explore.
The Explore tab uses charts to show team and rep behaviors that may influence your goals. There are three charts inside this tab – Top Teams, Top Individuals, and Contact Conversion Funnel.
Top Teams
The Top Teams chart shows how the groups across your team are performing in relation to a specific goal metric. This chart should be used to compare groups based on the highest total outcomes. As a manager, you can also see which team is having more success on specific days of the period.
Things to Note: If your team does not have groups set up, this chart will not appear.
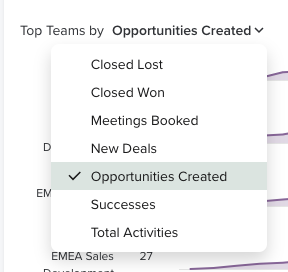
The Top Teams chart can show one goal metric at a time using the dropdown selector in the title. You can select between any of the following outcomes:
- Opportunities created [default]
- Meetings Booked
- New Pipeline Added (only if Deals enabled)
- New Deals (only if Deals enabled)
- Deals Closed (only if Deals enabled)
- Total Activities
- Successes
The data shown is cumulative. So, the chart grows over time as more metrics are included.
Let’s walk through the Top Teams chart:
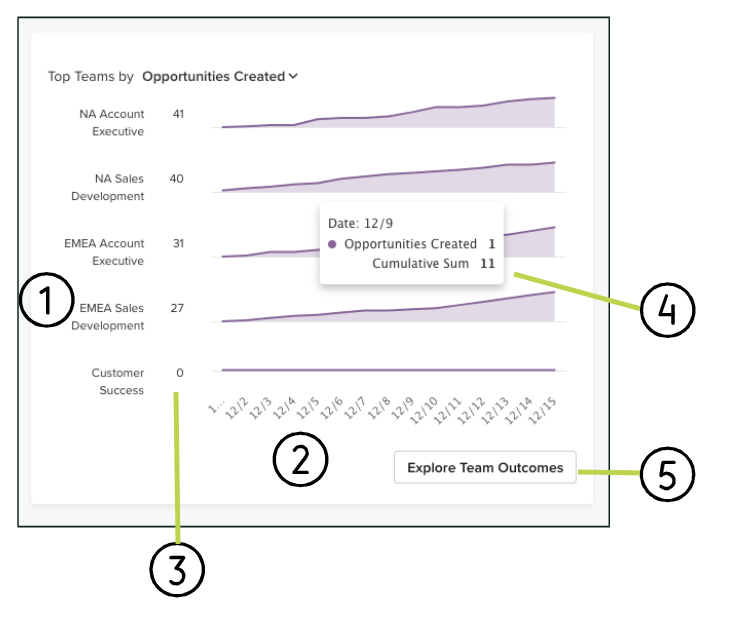
- Y-axis: Top five groups based on the selected metric. The chart shows up to five groups.
- X-Axis: The date range. This range will adjust to the Date filter on the Team Coaching dashboard.
- Outcome Total for Group: Amount of the metric achieved by that group.
- Hover data: The trend chart showing the cumulative total by day for the outcome. If you hover over the chart data, you will see a box with information pertaining to a specific day. The data in to the box includes:
- Date
- Outcome metric achieved that day by the group
- Cumulative sum as of that day
- Explore Team Outcomes button: Directs you to the Compare Teams tab in the Explore and Compare Section of the Team Coaching dashboard for further exploration.
Top Individuals
The Top Individuals chart compares the efforts of the members of your team. Managers can use this chart to quickly pinpoint which reps are most or least successful at accomplishing a specific outcome.
Similar to the Top Teams chart, the Top Individuals chart can show one goal metric at a time using the dropdown selector in the title. You can select between any of the following outcomes:
- Meetings Booked [default]: Compares the Total Activities completed to the number of meetings a rep was able to book. The metric suggests that reps that are able to book meetings with fewer activities are highly effective.
- Closed Won (only if Deals Enabled): Compares the Total Pipeline to the number of Closed Won revenue. There should be a healthy balance of pipeline coverage to revenue, with higher pipeline corresponding to higher closed won revenue.
- Opportunities Created: Compares the Total Activities completed with the number of opportunities created. The greater the number of activities should lead to more chances for opportunities to be created.
- Successes: Compares the number of Accounts Touched to the number of Successes logged in Salesloft. Ideally, the more accounts touched, the greater chance of success.
- New Pipeline Added (only if Deals Enabled): Compares the number of New Deals to the amount of new pipeline added. Ideally, new pipeline is spread across multiple, high quality deals rather than banking on just a few.
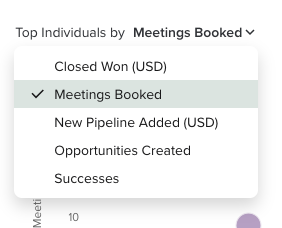
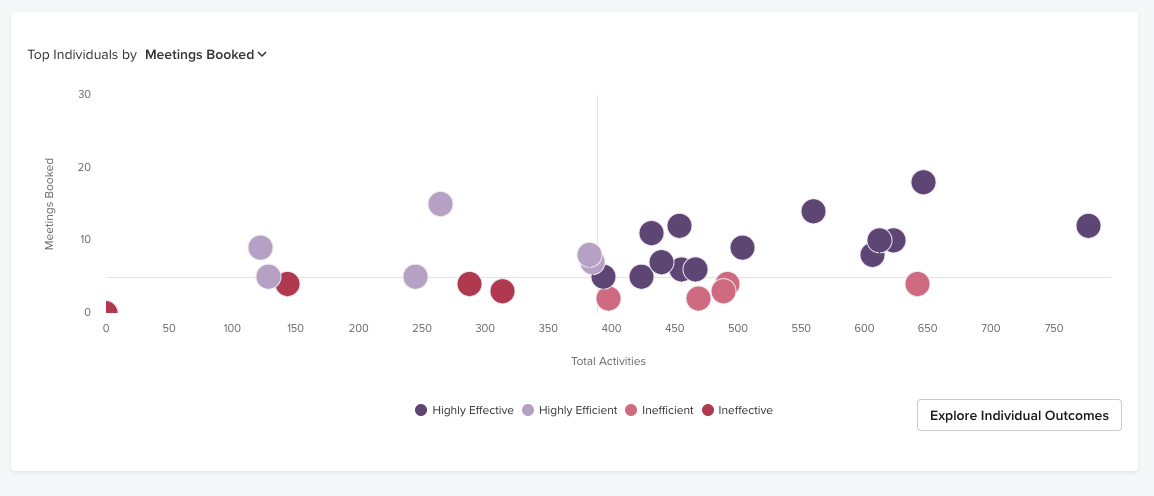
The Top Individuals Chart shows up to 50 reps, the outcome metric, and the effort metric.
Things to Note:
- Charts that include amounts will be listed using the currency pulled from Deals.
- If your team does not have groups set up, the top 50 users will be shown.
- This chart only appears when Team View permission is enabled.
The chart uses colored bubbles to show a range of efficiency and effectiveness of the reps on your team. There are four segment categories each rep could fall in depending on their results to effort:
Symbol
|
Description
|
Definition
|
 | Highly Effective
> team average x-axis
And
> team average y-axis | These reps are the clear leaders in terms of outcome results, although they also require more effort to achieve those outcomes. They may need some coaching to be more efficient with their time. |
 | Highly Efficient
< team average x-axis
And
> team average y-axis | These reps get the high results with the least amount of effort and may represent best practices that can be replicated across the team. |
 | Inefficient
> team average x-axis
And
< team average y-axis | These reps are putting in a lot of effort for small results and may need more coaching to be more effective with the sales process. |
 | Ineffective
< team average x-axis
And
< team average y-axis | These reps are not putting in much effort and not achieving much in terms of results. Therefore, they need the most attention and a potential course correction if overall goal achievement is low. |
Finally, the Top reps chart includes the Explore Individual Outcomes button. This button directs you to the Compare Individuals tab found under the Explore and Compare section of the Team Coaching dashboard.
Contact Conversion Funnel
The final chart found inside the Explore tab of the Team Coaching Dashboard is the Contact Conversation Funnel chart. This chart reveals how successful your team’s prospecting efforts are throughout the entire overall sales process.
The Contact Conversion Funnel is a lot like retracing your sales steps. The funnel shows the metrics that contribute to your sales process. Ideally, high results across the funnel should lead to a high number of positive outcomes. Alternatively, if there are gaps in the funnel, it could suggest there are improvements to be made to reach the desired outcomes.
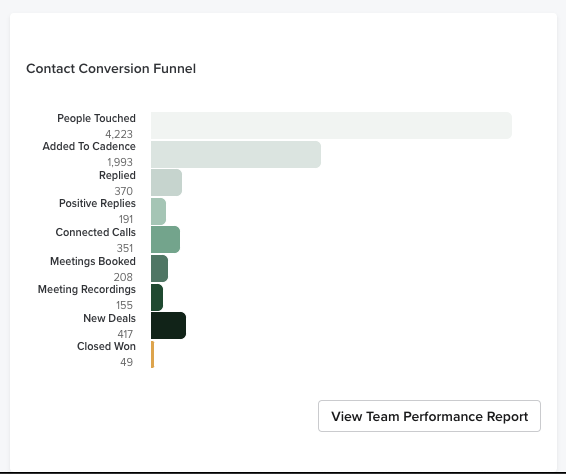
The following metrics are included in the Contact Conversion Funnel:
|
People touched
|
Positive Replies
|
Meeting Recordings (only if Conversations enabled)
|
|
Added to Cadence
|
Connected Calls
|
Opportunities Created
- or -
New Deals (Deals customers only)
|
|
Replied
|
Meetings Booked
|
Closed Won (only if Deals enabled)
|
The metrics in the Contact Conversation Funnel will show the total number for that metric and a colored bar representing that amount.
Let’s walk through a simple example. It’s the end of the month. You take a look at your Goal Panels and notice your team is behind on their Opportunities Created. This could have a negative impact on the number of closed deals you have in the quarter. When you look at the Contact Conversion Funnel chart, you can ask the following questions:
- Are we reaching out to enough People? Is the People Touched bar too low?
- Are you seeing enough replies? If they are low, should you update your templates where the reply percentage is low?
- Are you seeing low call connections? Maybe you need to retrain on phone research or better times to call?
- Are you not converting replies and connected calls to meetings enough and maybe need to work on handling objections better?
- Are those meetings not converting to enough opps and maybe need to work on qualifying opps better?
The final two tabs inside the Explore and Compare section are the Compare Teams and Compare Individuals tabs. Inside each of those tabs you can view a table that shows goals and metrics broken down in the following ways:
- Compare Teams: This section shows metrics and goals across groups so leaders and managers can keep track of performance effort and goal achievement.
- Compare Individuals: Shows goals by users. This is ideal for comparing the way your team is performing on a rep-to-rep basis. If a rep is lagging behind, you can view their Individual Coaching page for additional review.
Thing to Note: If your team does not have Groups set up in Salesloft, the Compare Teams tab will not appear.
This section primarily consists of a single table with metrics by teams as well as in-line charts with the goal progress for the period. Clicking on each team’s name will take the manager to the Coaching Individual List filtered for that team.
Let’s take a look at what is included inside the Compare Teams and the Compare Individuals sections:
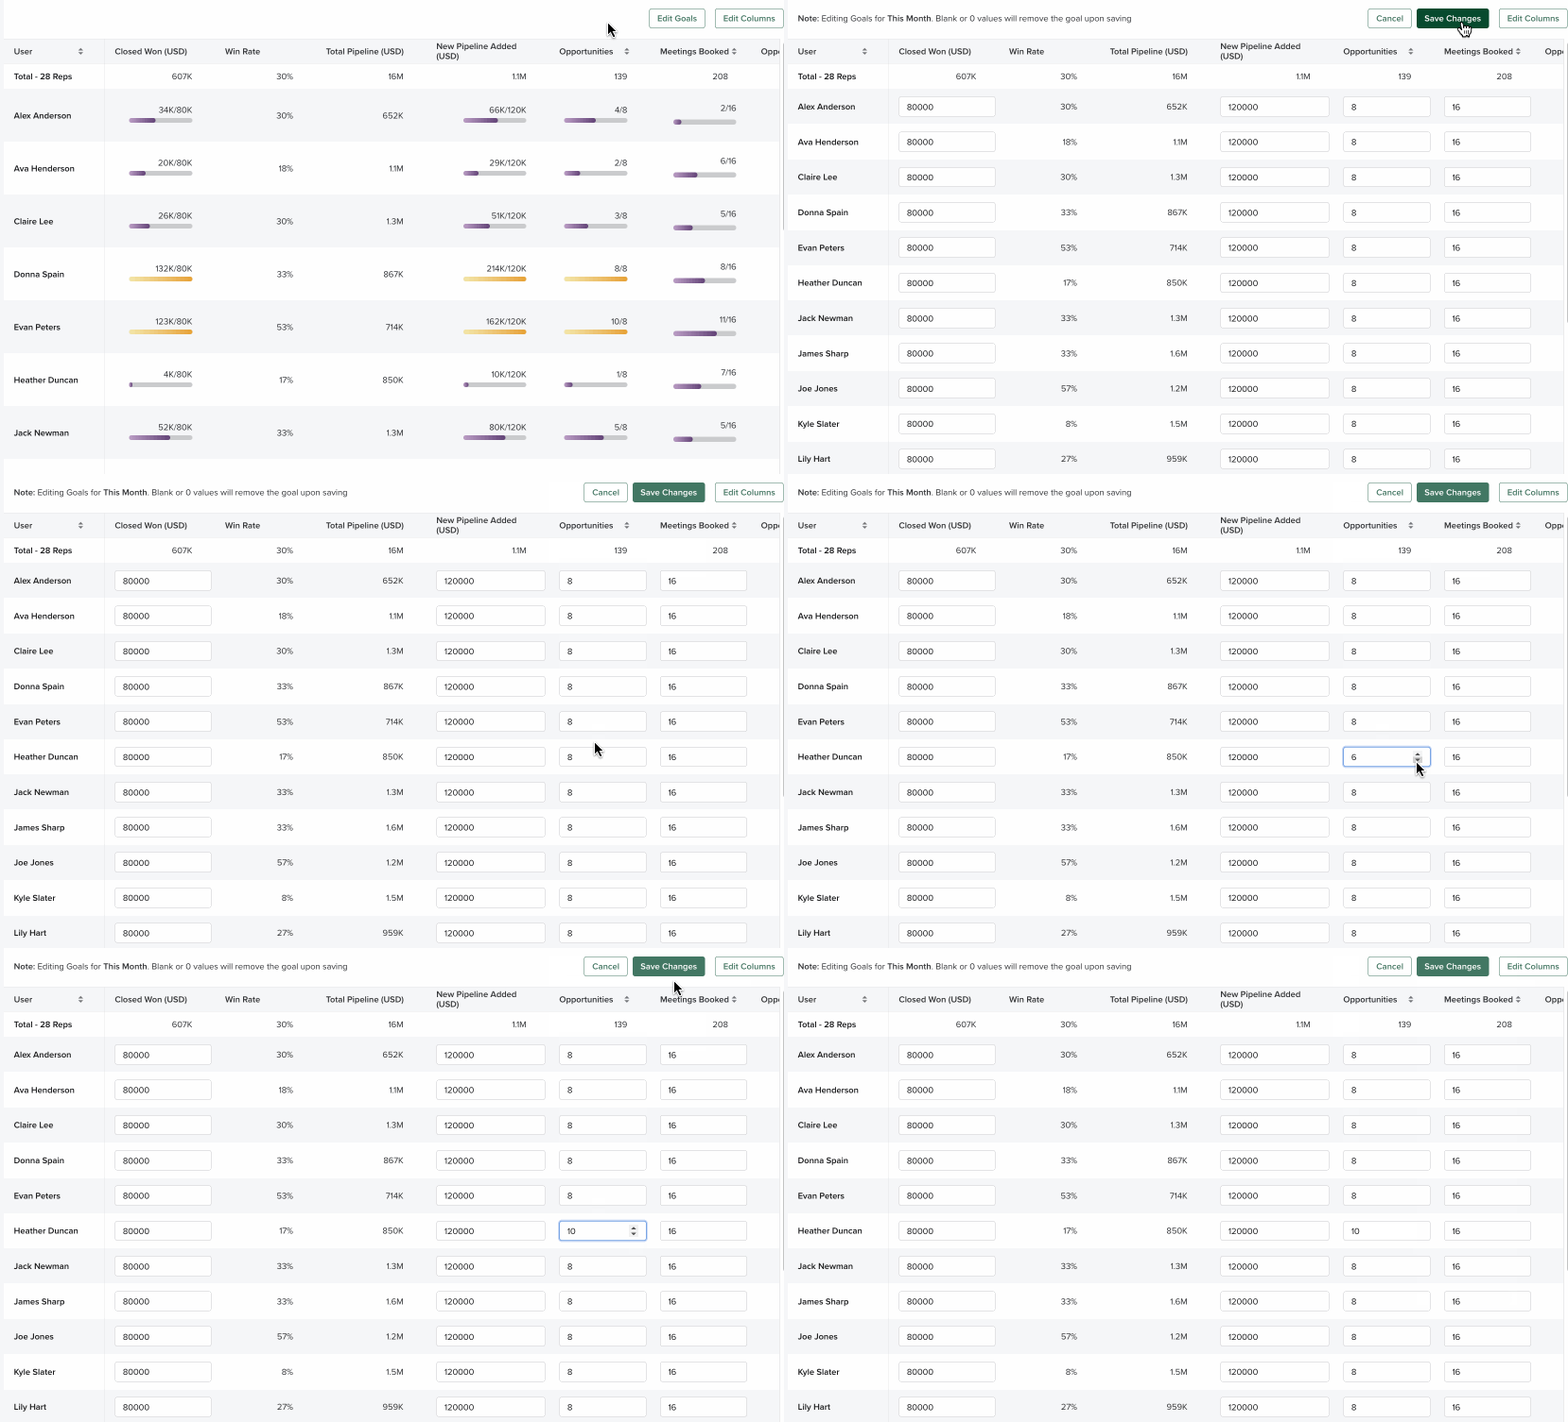
1. Edit Goals: Button to edit the goals inside the Compare Teams table. When you click this button, goal-related metrics will appear as editable text boxes. Enter a number in any of the fields before clicking Save Changes to update goals.
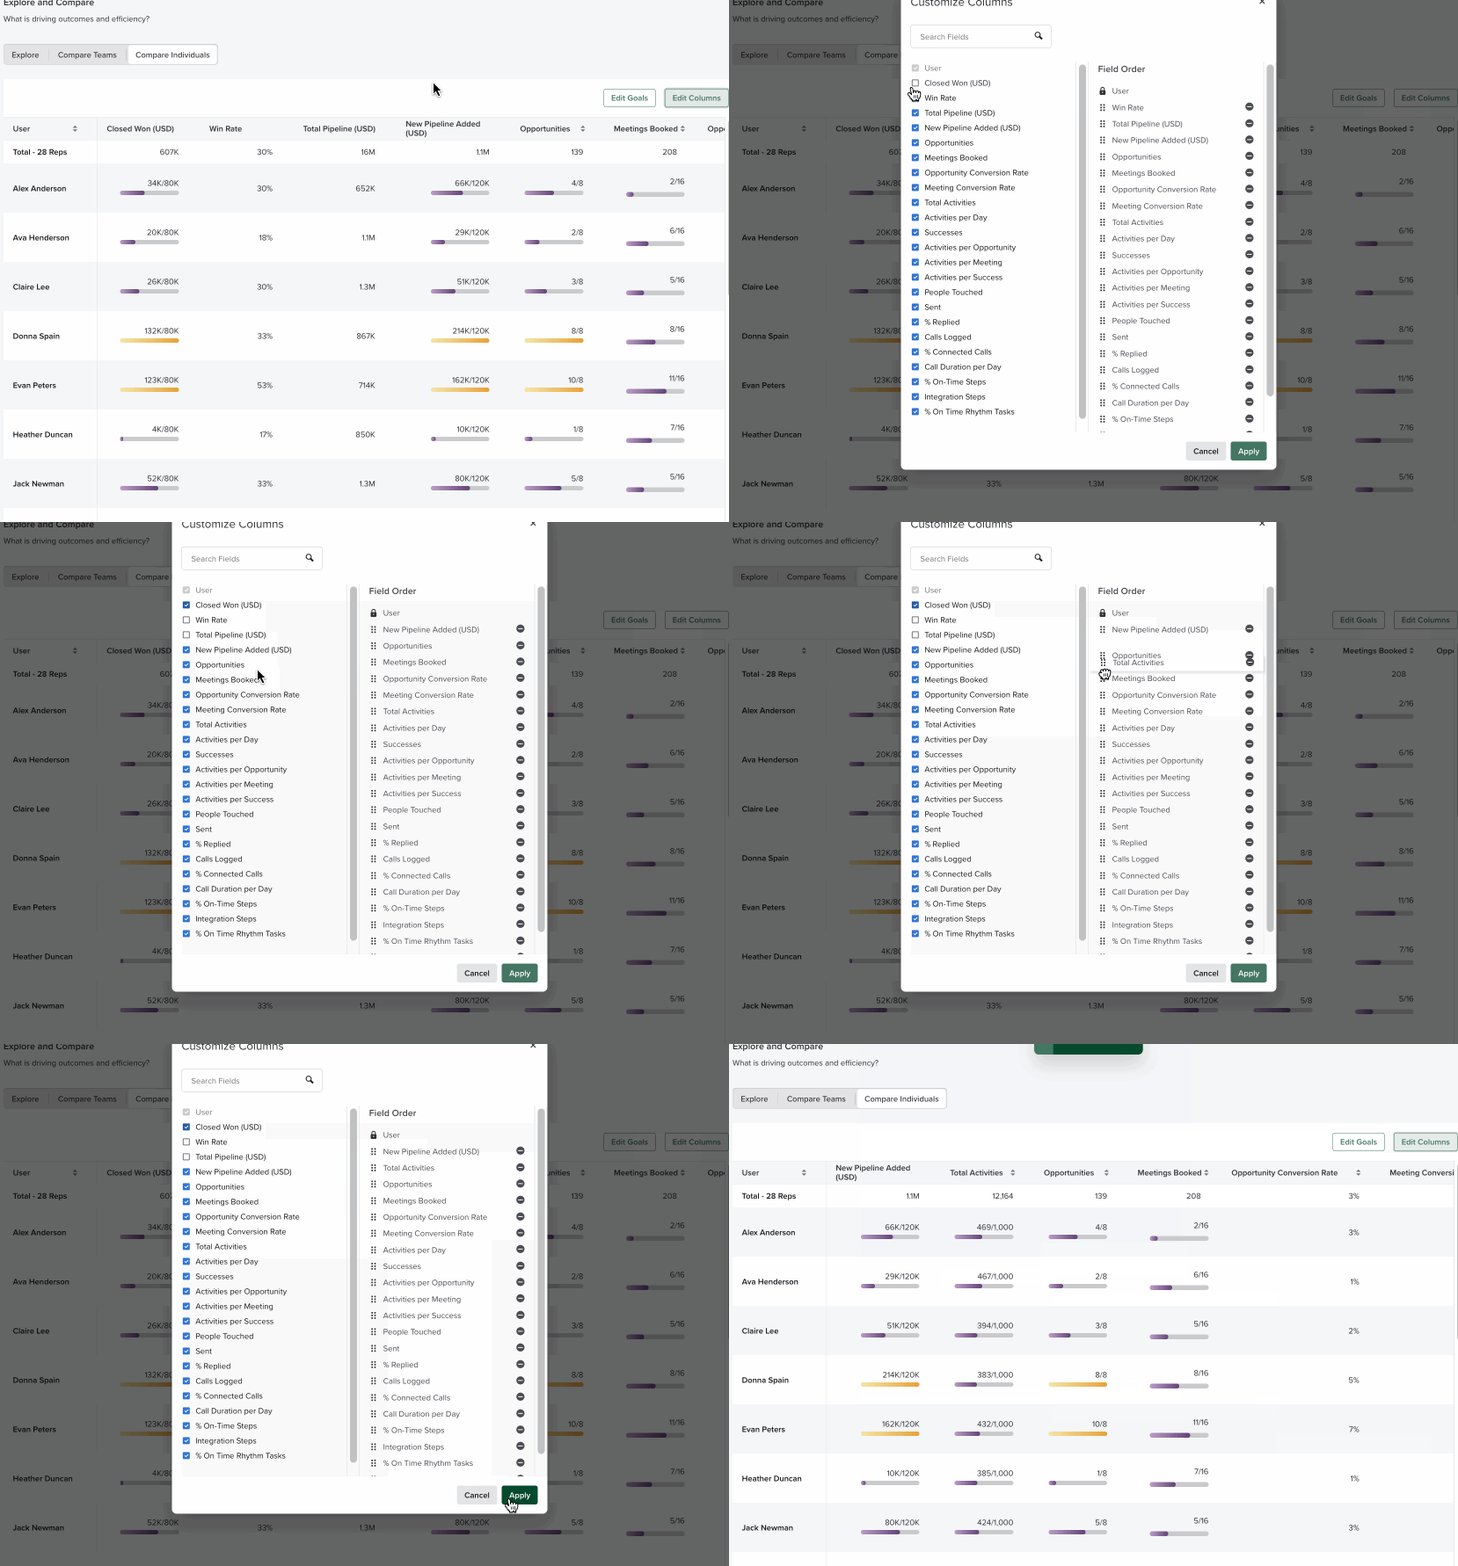
2. Edit Columns: Button that allows you to control which metric fields are visible in the Compare Teams table. This is particularly beneficial if you only want to focus on certain goals (only goals leading to opportunities or only goals impacting closed deals).
3. Name
- Group: Clickable link that directs you to the Individual Coaching List view filtered for that team
- User: Clickable link that takes you to that rep’s Individual Coaching detail page
4. Metrics: A measurable result. Each column in the table represents a single metric. The numbers are the amount of times that metric has been completed.
5. Goal Metrics: Metrics that include a set goal. These metrics will include in-line charts with the goal progress for the period. The bar indicates the percentage towards that goal based on what has actually been achieved. Similar to the Goal Panels, this bar will appear purple as the group is working toward the goal. Achieved goals appear gold.
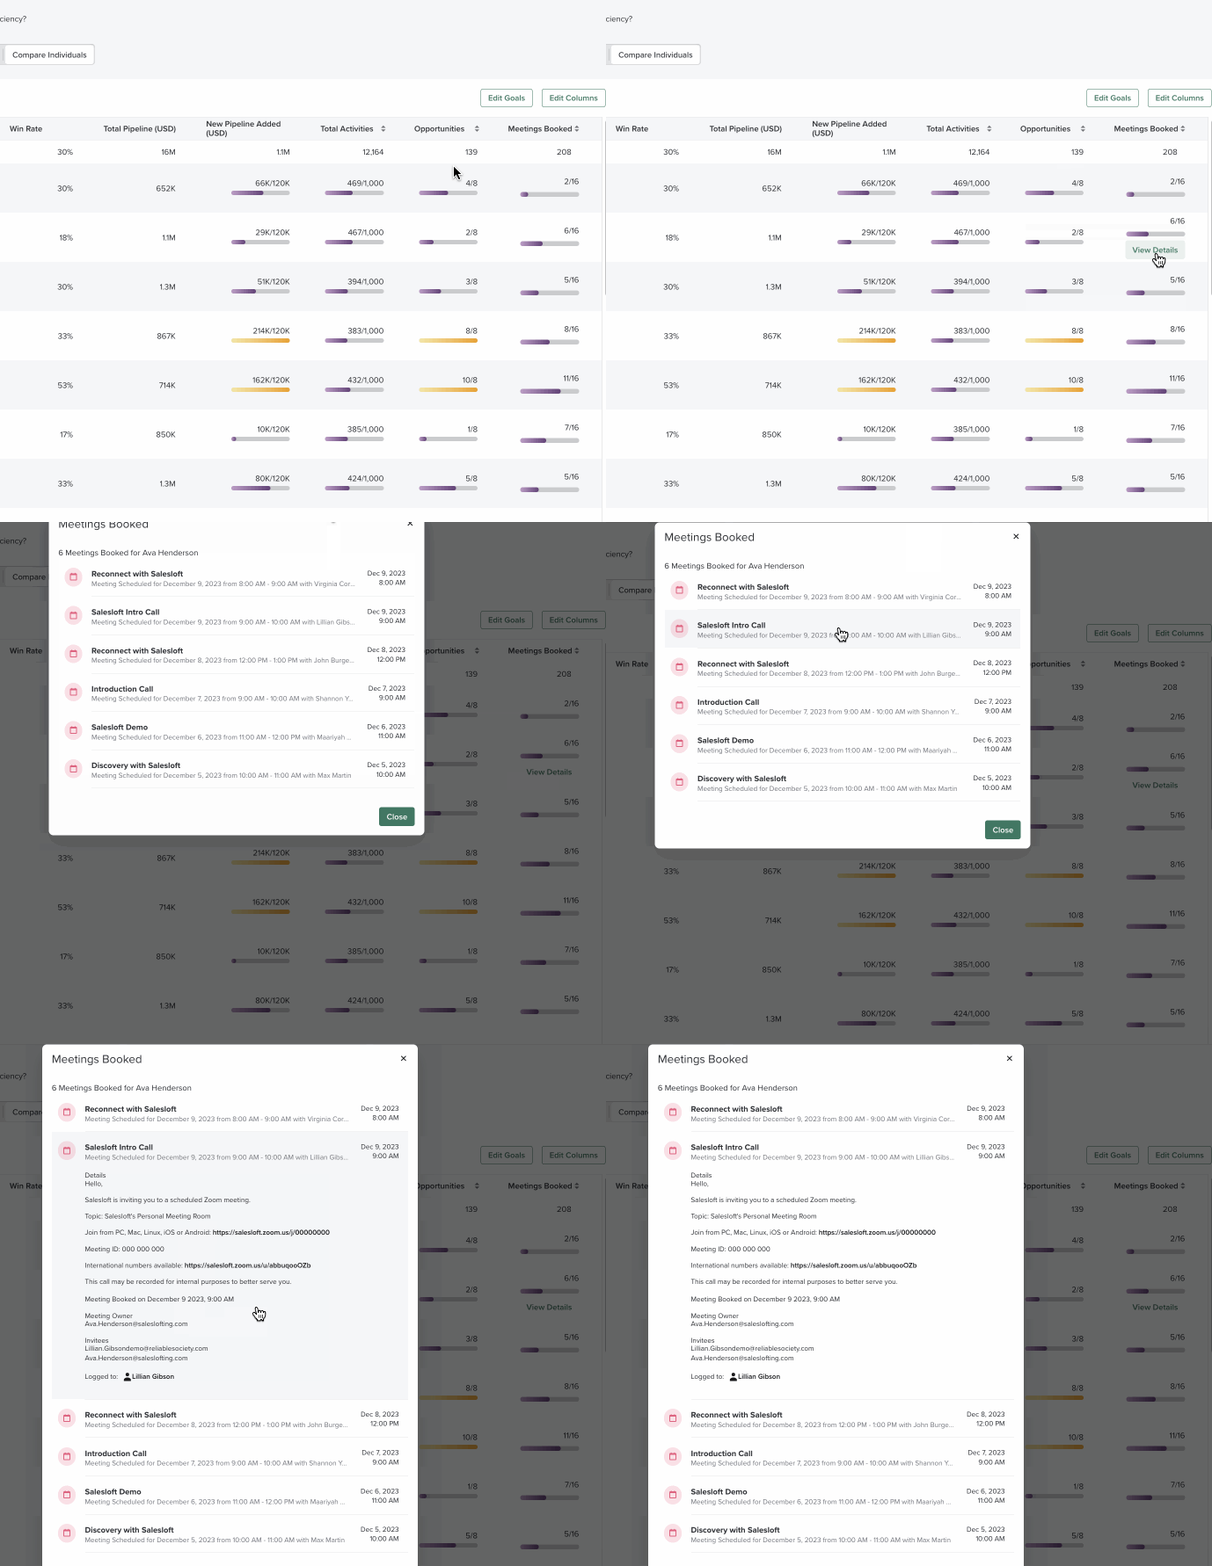
6. View Details: For metrics like Meetings Booked, you can click into the total to see the individual meeting details in a list.