Creating Charts
Overview
Charts help you visualize your pipeline to quickly get a pulse of the business and assess areas of strength and weakness.
This article will walk you through the basics of creating charts and recommend some charts that may be useful to you.
Chart Mode
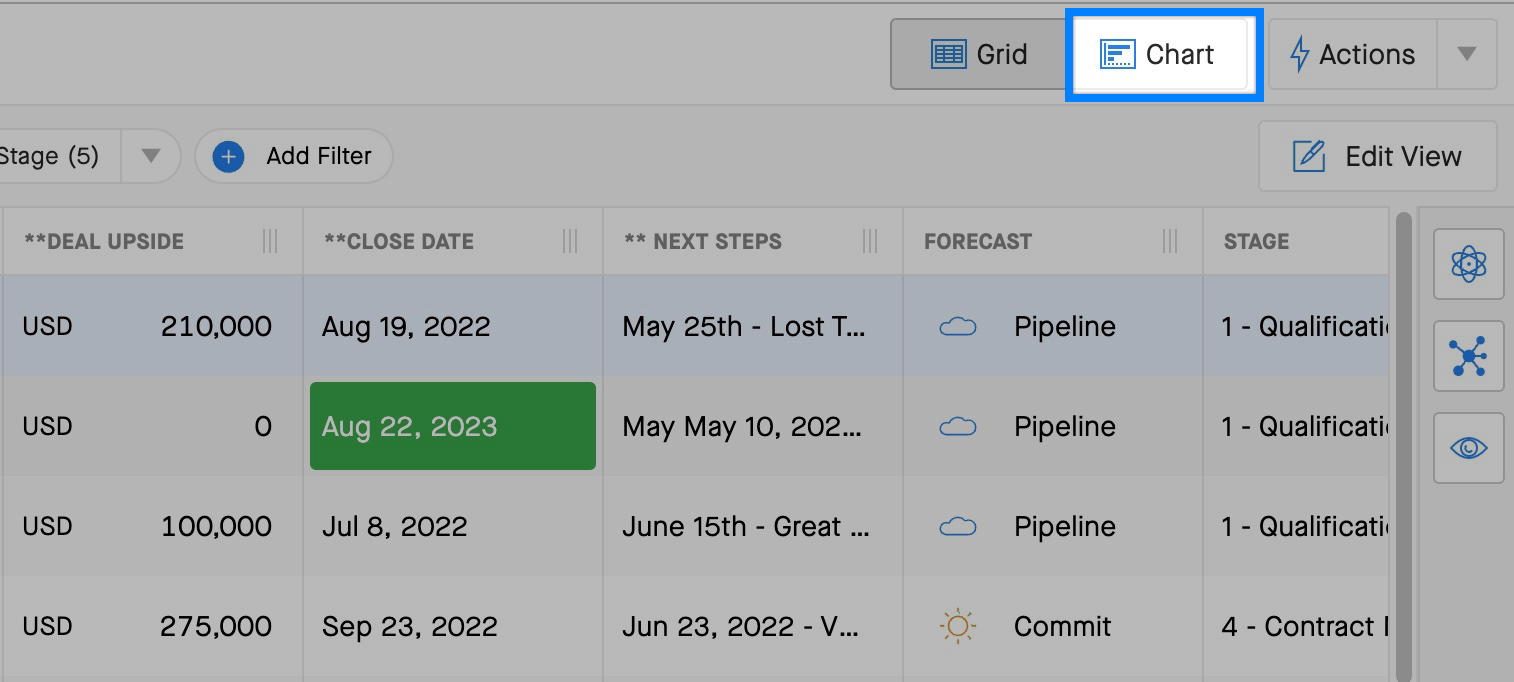
When you're in Opportunities, you can toggle between Grid Mode and Chart Mode.
To switch to Chart Mode, click the Chart button above the deals in the grid.
Groups in Chart Mode
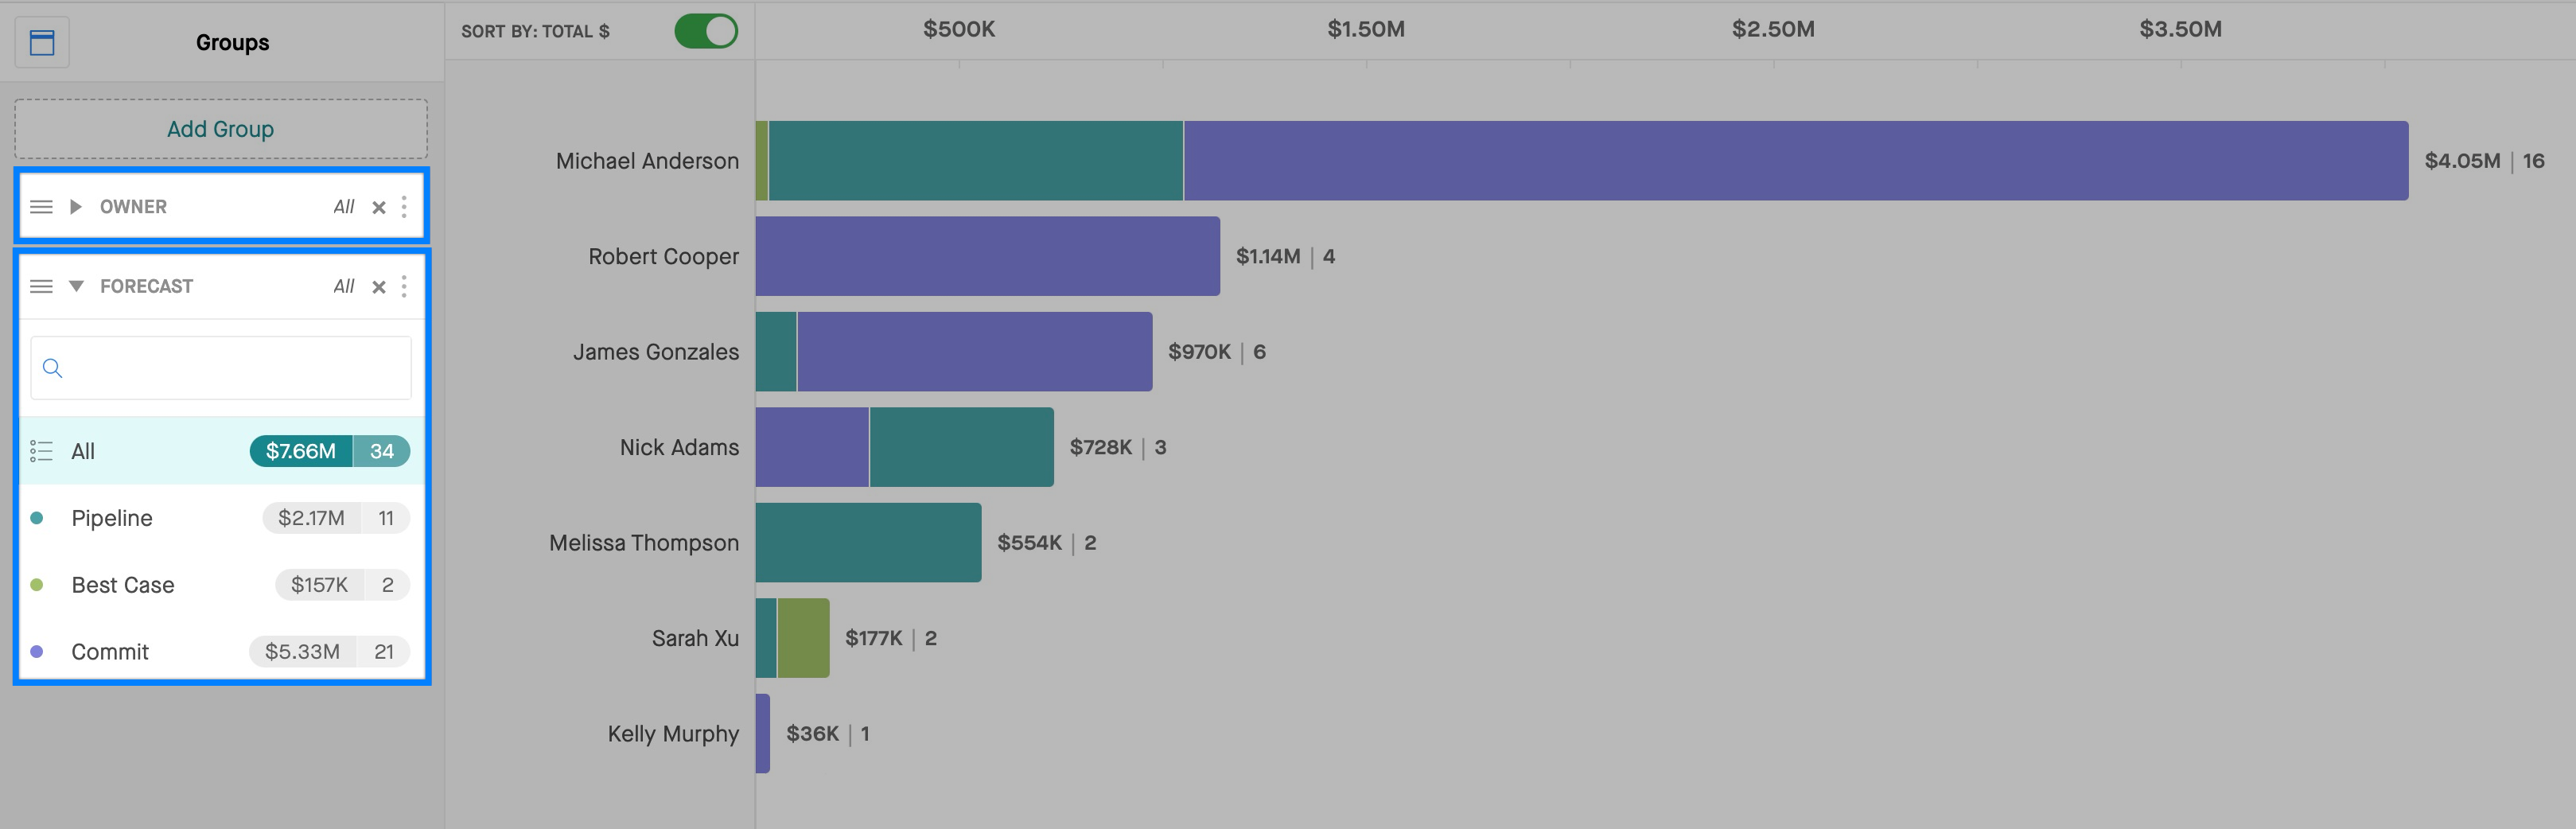
Your groups define the different dimensions of your chart.
- The first or primary Group controls the vertical axis of the Chart.
- The second Group segments the bars in the Chart.
In the example below, the first group is Owner, so you see the total $ and number of deals each rep still has in play. The second is Forecast, which breaks down the bars so you see the distribution of Pipeline, Best Case, and Commit for each rep.
From Chart Mode, you can drill back down into the individual deals that make up a segment by clicking.

To go back to the
Chart you just came from, make sure to click the link that says "
Click here to go back to the chart you just came from."

Sort by Total $
You can use the Sort By Total $ toggle to change the order of the bars in the chart from alphabetical to $.

Recommended Chart Configurations
The different Charts you can create are dependent on the grouping options that have been set up for your Clari account, but below are a few commonly used Charts.
Owner by Forecast
Quickly see what each rep is working on for the quarter and what his / her forecast looks like.
Forecast by Stage
See exactly what you have across each of your forecast categories and what stage the deals are in. In chart mode, it's easy to spot Stage <> Forecast discrepancies. As an example, should that Stage 5 - Negotiation deal really be in Pipeline?
Close Date by Forecast
Quickly see what your forecast looks like for month 1, 2 and 3 of the quarter. Or look across multiple quarters at the whole fiscal year.
(4) Reseller (or Partner) & Forecast
View all of your deals by Reseller. Get visibility into which Resellers you're working with and what deals they're involved with.