Salesloft Forecast is a forecasting software that combines AI tools with CRM data for accurate revenue forecasts.
Forecast helps sales teams predict future sales performance using data-centric dashboards that provide visibility into deal stages and historical data for predictions. It integrates with Salesforce and offers real-time updates for accurate tracking.
The following roles are involved in creating a sales forecast and how they will use Forecast in Salesloft, including:
- Sales Reps - sales reps use Forecast to submit their sales forecast numbers which are used to build the entire company’s sales forecast.
- Front Line Sales Managers- Sales managers submit a forecast number to their direct superior using Forecast. This number is based off of the data that their sales reps upload into Forecast.
- Sales Leaders - Sales Leaders can use Forecast to promote sales forecasting accuracy and even tie compensation to it, if necessary
- Revenue Operations - Revenue Operations can bring best practices and help arrive at a number the organization is confident in.
Forecast is available to customers with the Premier Package.
Salesloft team admins on the Premier license have access to Forecast by default. As soon as someone is granted access to Salesloft with the default Admin role, they can enter the Deals Forecast section of the Deals Admin Settings and configure the Forecast setup.
Before your team can participate in Forecasts, a team admin must grant feature access and complete the Forecast configuration. This setup determines how reps, managers, and sales leaders add and view forecast numbers. Learn more in the Forecast Setup Checklist.
Non-admins cannot see Forecast or use the feature unless the following permissions are enabled for their user role.
- View Forecasting: Can view the Forecast tab inside Deals
- View Full Forecast Hierarchy: Can view the Full Forecast Hierarchy
- View all Opportunities in Salesloft: Some teams have users who require access to Forecast and all forecast data but may not be submitting forecasts. Typically these roles are individuals like revenue operations. Grants access to view Forecast and ALL forecast data, you will assign the Forecasting role permission and then we will assign them a second permission, with no access restrictions.
- Export Team Analytics: To download your Forecast History Reports. This permission allows the user to download a CSV file of previous periods’ forecast history and determine the accuracy of those forecasts.
When users are ready to use Forecast, they must Connect to Salesforce before they can submit forecasts.
To access Forecast in Salesloft, hover over the Workspaces menu and select Forecast.
You can also access Forecast by using one of the following methods:
- Use the keyboard shortcut G F.
- From the Deals page, select the Forecast tab to view your Forecast Dashboard.
Once you’re inside the main Forecast page, you will see the Forecast dashboard.
The Forecast Dashboard provides a visual representation of your team’s forecasted numbers using data-filled charts and tables. Team members can efficiently review ongoing deals and take action to close more revenue.
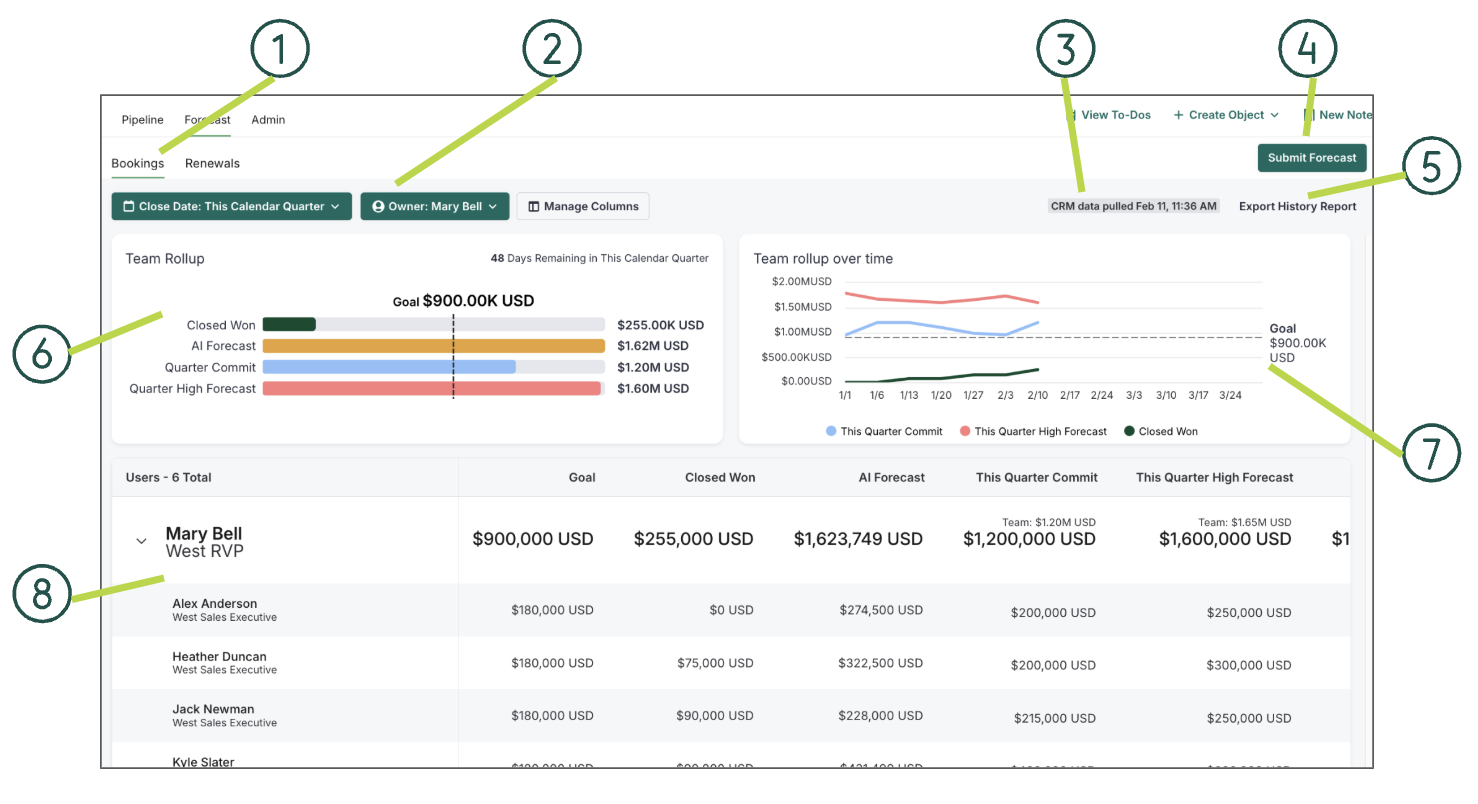
Figure 1: Example: Forecast Dashboard
Let’s walk through the Forecast Dashboard layout:
- Segments: Forecast Segments allow teams to view opportunities based on the data that is most important to the forecast being . Each Segment is represented by a tab that is set up by a Salesloft admin. The name of each tab will vary by team and use case.
- Filters: You can use the Forecast Dashboard filters to refine the data shown on the Forecast Dashboard based on the following:
- Deal Owner The Owner filter allows you to view other owner's forecast or different variations of the hierarchy.
-
- Things to Note: When you filter by a Specific User, you will see the data for that user, as well as their direct and indirect reports. You cannot deselect the specific user’s direct and indirect reports.
- Deal Close Date: The date or time frame in which an opportunity is expected to close.
- Things to Note:
- By default, the Forecast Dashboard shows your forecast metrics for This Month.
- The Dashboard will only include data for the current time period.
- The filter options will include Calendar year OR Fiscal year based on how your team's settings are configured in Salesforce.
- If you use the standard fiscal year then the filters will show "Calendar."
- If you build a customer fiscal year then your filters will show "Fiscal.
- Submit Forecast Button: The Submit Forecast Button is used to submit your sales forecast numbers.
- Things to Note:
- Each user submits their own forecast.
- Admins and users with the Manage Forecast Submissions permission have the ability to Submit a Forecast on Behalf of a User.
- All users should only be able to submit forecasts for segments they are visible in via the Hierarchy Visibility admin feature. For more information see our article on how to Manage Deals Forecast Settings.
- Last CRM Data Pull Time: The time at which opportunity data was last synced from your CRM.
- Export History Report: Within Salesloft's Forecast, teams have the ability to export a history report of your complete Forecasts. The Forecast history can be downloaded as a CSV file.
- Team Rollup Chart: Shows the accumulated Forecast values based on your filters.
- Weekly Trend Chart: Shows how your forecast has changed over a period of time.
- Hierarchy Table: Lists your team’s opportunities within a given close date period.
The Forecast Dashboards are located beneath the filter options. These include:
- Team Rollup Chart: Shows the accumulated Forecast values based on your filters.
- Team Rollup Over Time: Shows how your forecast has changed over a period of time.
- Hierarchy Table: Lists your team’s opportunities within a given close date period.
Let's take a deeper look at each dashboard:
The Team Rollup Chart shows the accumulated Forecast values based on your filters. Salesloft gives each team a set of default metrics but an admin can configure the Forecast Rollup Metrics that apply to your team.
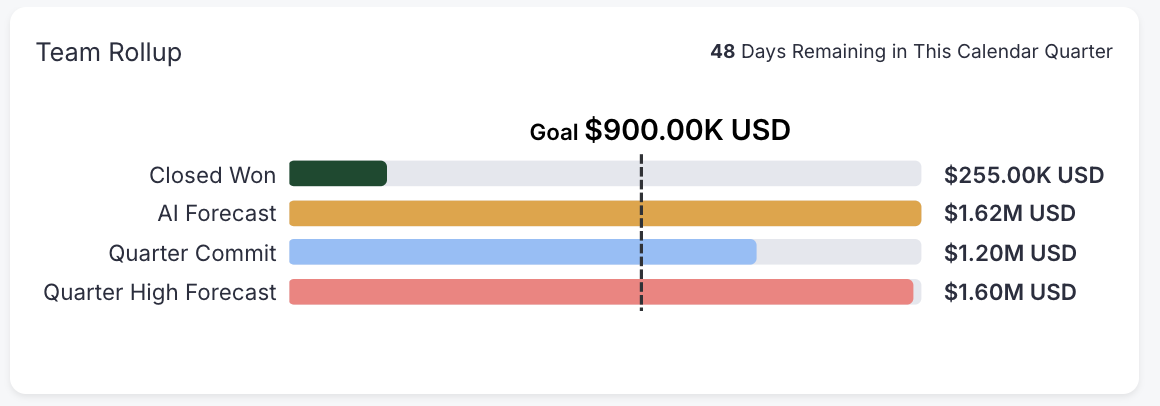
Figure 2: Example: Forecast Team Rollup
The upper right corner of the panel shows how many days are remaining in this fiscal quarter for your team. This information is pulled from your Salesforce configuration.
The bar chart displays your Triangulation values, which can be compared to the Goal set. Each bar displays a percentage amount inside the bar that compares the amount to the goal value. Hover over a bar to see what the percentage of target is.
Things to Note:
- The default values include Goal, Forecast, Closed Won, and Open + Closed. If AI Forecast is not enabled for your team, the Weighted Pipeline value will show instead. For more information, check out our Weighted Pipeline article. Additional metrics can be customized and added via admin settings.
- The Goal and Forecast values must be input by each Salesloft user. If they are not inputted, these values will appear blank in the chart. The goal is submitted via admin settings. The forecast is submitted by the user viewing the page (more on this later in the document).
The Team Rollup Over Time chart plots your team’s rollup values to show how your forecast has changed over a period of time.
Things to Note: The triangulation values may differ
The values on the Team Rollup Over Time chart are generated based on the close date period you select using the Close Date filter
The Team Rollup Over Time chart generates a dotted line to indicate your team’s target revenue goal. Use this line to compare your forecast metrics to your target revenue goal over the selected close date period.
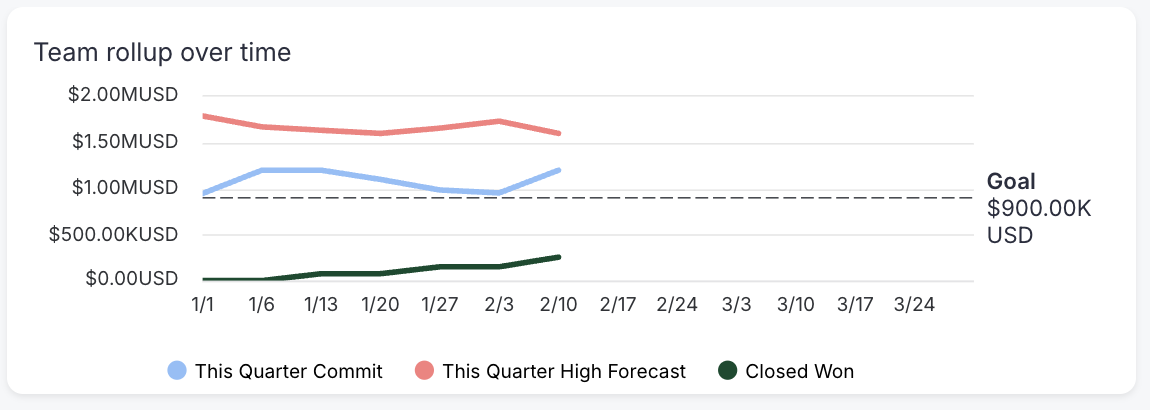
Figure 3: Example: Forecast Team Rollup Over Time
The Forecast Hierarchy table lists your team’s opportunities within a given close date period.
Next to each user in the table, are metrics based on the Forecast Rollup Metrics. Admins can customize which metrics appear in their Forecast view on the page by clicking on the Manage Columns button above the table.
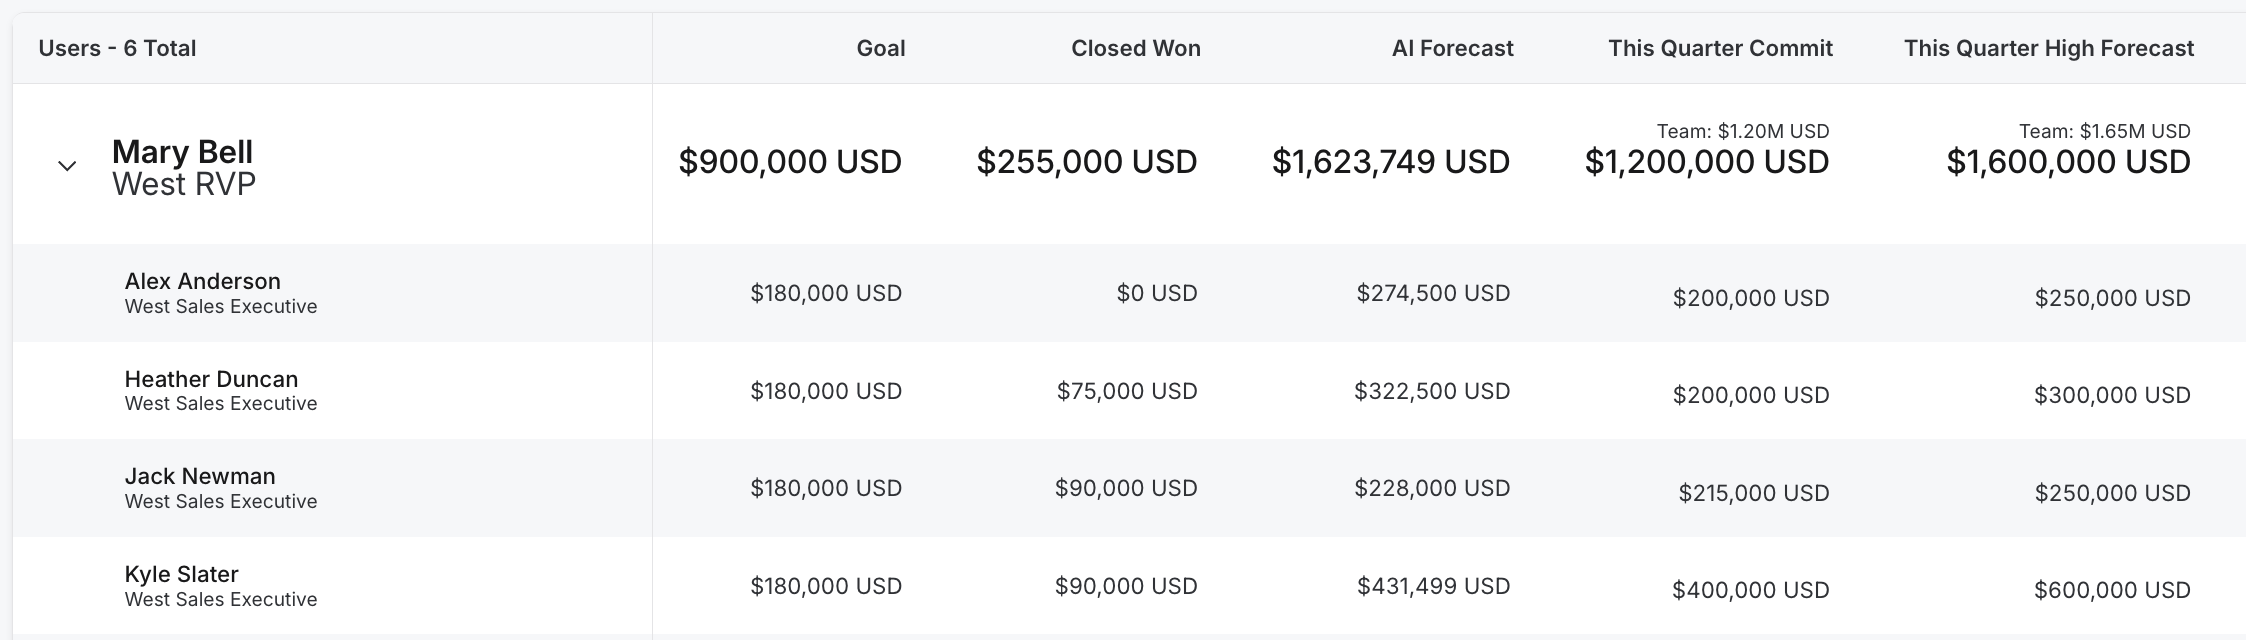
Figure 4: Example: Forecast Hierarchy Table
By default, the Forecast Hierarchy table shows your team’s forecast metrics and opportunities for the current month.
The table focuses on two sets of data:
- Users: the list of team members displayed on the table.
- Hierarchy Rollup Metrics: The headers in the Forecast Hierarchy table align with the items in the Team Rollup panel and the metrics associated with each team member.
The cells beneath each table header in the table contain an amount that you can click to open the Cell Details View. The amounts will show the currency related to the opportunity data.
Things to Note:
- The Goals cell is not clickable and will not open a cell details view.
- If your team uses Multi-Currency in Deals, the data in the hierarchy table will show the ISO code and the corporate currency amounts.
If your team does not have AI Forecast, clicking on any value in the Weighted Pipeline column will pop open a flyout panel. This flyout displays the rollup metrics of the Weighted Pipeline. Here, each stage is given a percentage that represents the probability of closing.
Things to Note:
- The table view may appear different based on your Salesloft permissions and your CRM Manager settings. Users with the View All Forecasting Permission enabled and who are labeled as a Manager in their CRM will see a list of users. Individual contributors may only see their own data in the Hierarchy table. In this article, we will primarily explain the manager view in which your team members are visible.
- You can drill into eight (8) levels within the hierarchy table.
The Expand Opportunities option inside the Flyout redirects you to a pipeline list-view of the opportunities presented in the Cell Details.
On the left side of the screen, you will see a minimized version of the Hierarchy Table, including a list of users in the first column listed. By referencing team member amounts in this minimized table, you can decide about the opportunities you are viewing.
Once you are done looking at the Expanded Opportunities list, select Minimize Opportunities or the X in the upper right corner of the view to return to the Forecast Dashboard Overview.
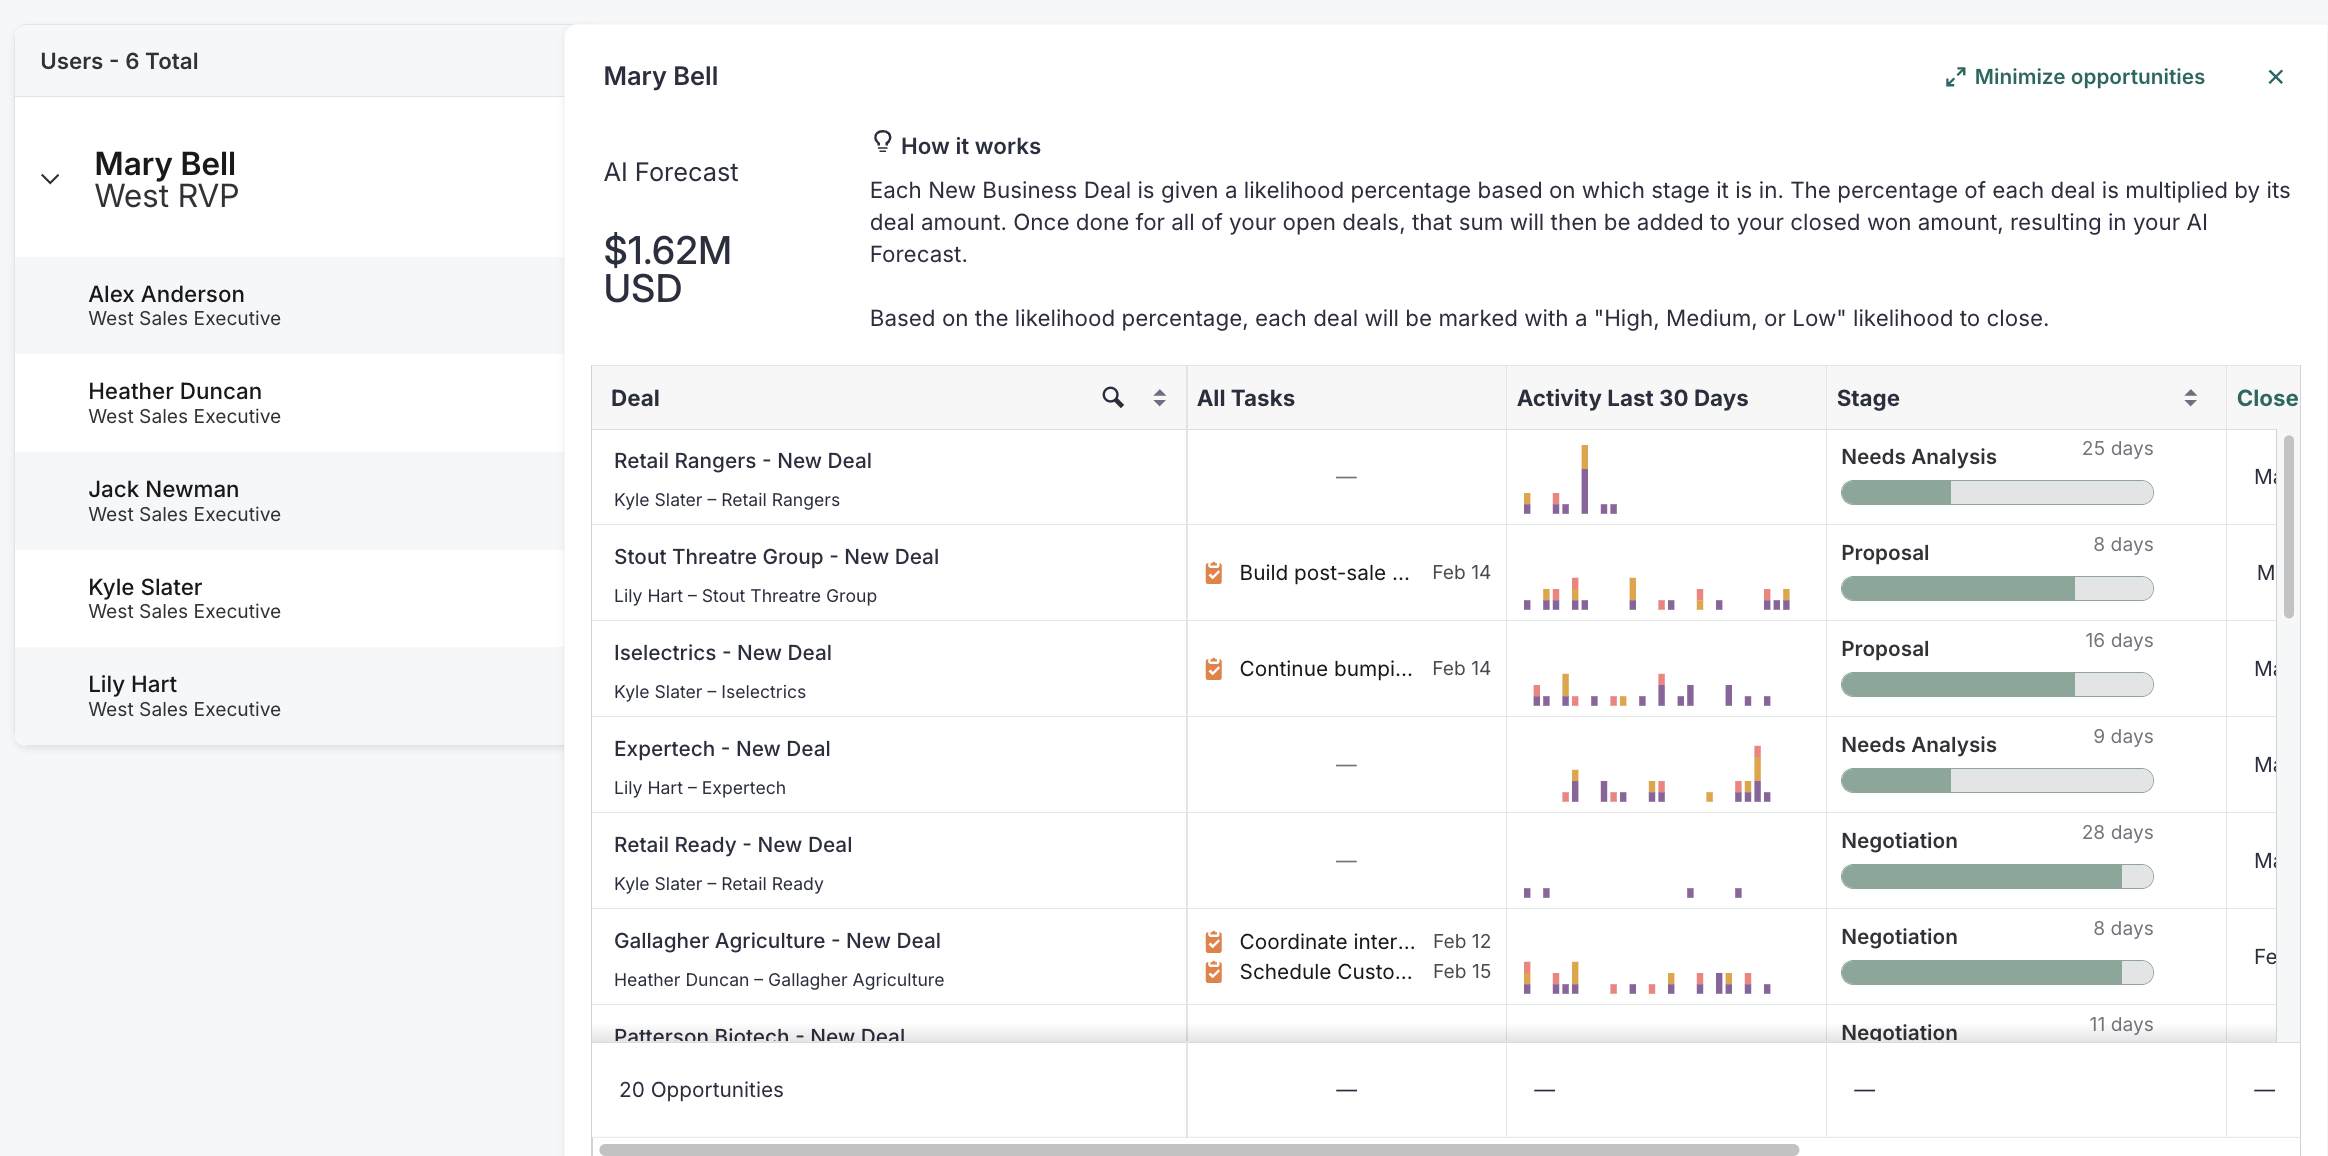
Figure 5: Example: Forecast Expanded Opportunities