Analytics Reports are included inside each Analytics pageview. Reports provide a table view of your metrics so you can get a complete look at all of your relevant data.
You can customize reports on these pages to help answer specific questions including the following:
- Who are the top/bottom performers on my team?
- How do my groups compare?
- What are the best days and times to send emails?
- Which Accounts or Cadences do I want to keep an eye on?
To create a custom report, use filters and column management to select the data you want to view. Once your report meets your needs, you can save the report. After you save a report, you can access it any time inside the Saved views.
You will find the Saved Views, filters, and exports buttons below the report name and about the report itself.
In this article, you will learn how to create custom reports, including:
Before You Create Custom Views
- In order to create custom reports, you must have a Salesloft account. Creating custom reports is available to all Salesloft users.
- If you have selected a Display By filter, that column will appear first in the report by default.
For an overview of the Custom Report Views, check out the video below.
To create a custom report, use filters and column management to select the data you want to view. Once your report meets your needs, you can save the report. After you save a report, you can access it any time.
- Filter your report: Filters adjust the data set and change the metrics you will see in your report. To apply a filter, select the filter tab at the top of the report. A drop down menu will appear where you can select a filter option. You can add multiple filters at a time.
- Edit Columns: Select the Edit Column button found on the far right side of the filter row. The Customize Columns window will appear. Search for the fields you want to add to the report and remove the fields you don’t want included in the report. Click Select All to select all of the fields at once. Click Apply once you are done editing columns.
- Save: Click Save View As to save your custom report.
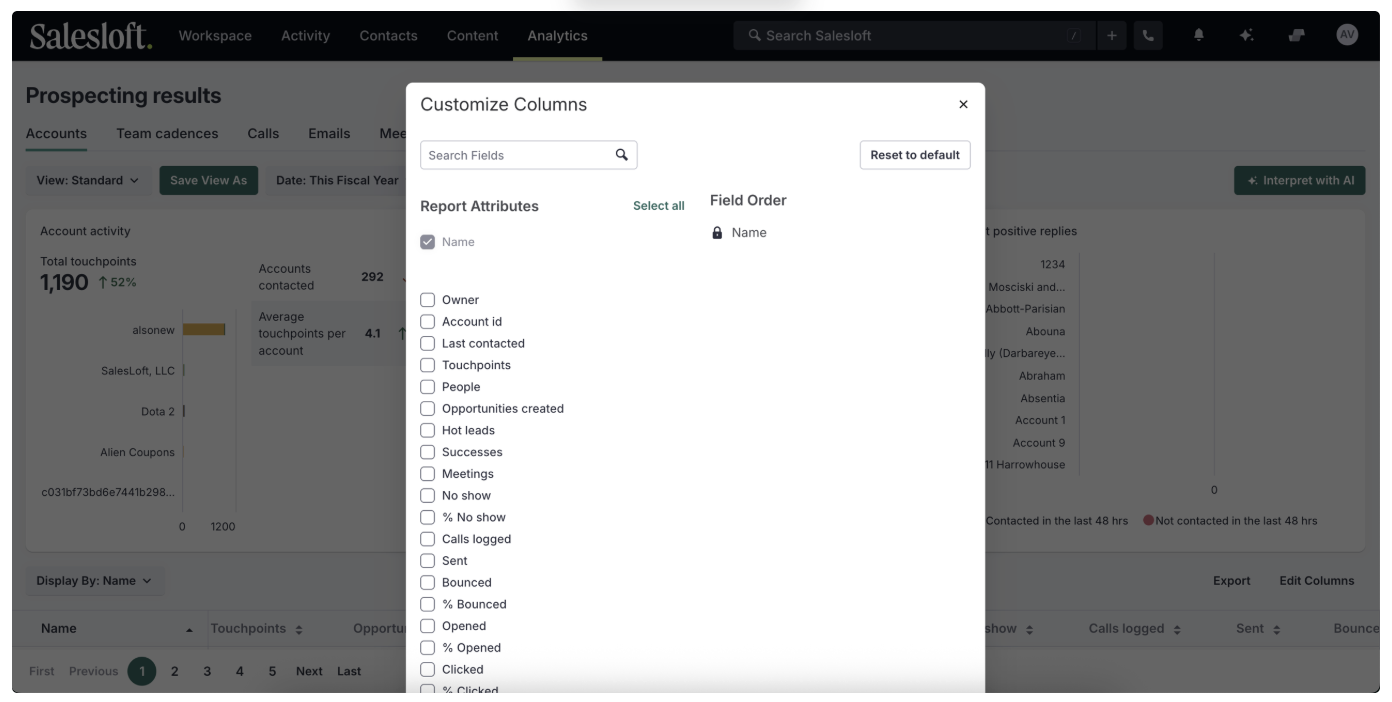
Figure 1: Customize Columns window
Within Salesloft Analytics, you have the option to share Saved Views with other users in Salesloft. A shared Saved View can be created as a new Saved View, or you can edit an existing Saved View to make it shareable.
To create a shared Saved View from scratch, follow these steps:
- Navigate to the Analytics page: Open Salesloft Analytics and select the report page you want to create a Saved View for.
- Apply filters: Select the filters you want to report on.
- Save filters: Click the Save button.
- Title the view: Give the Saved View a Title.
- Make Shareable: Select the checkbox next to Share this view with the rest of your organization to make the view shareable.
- Save the view: Click the Save button to create the Saved View.
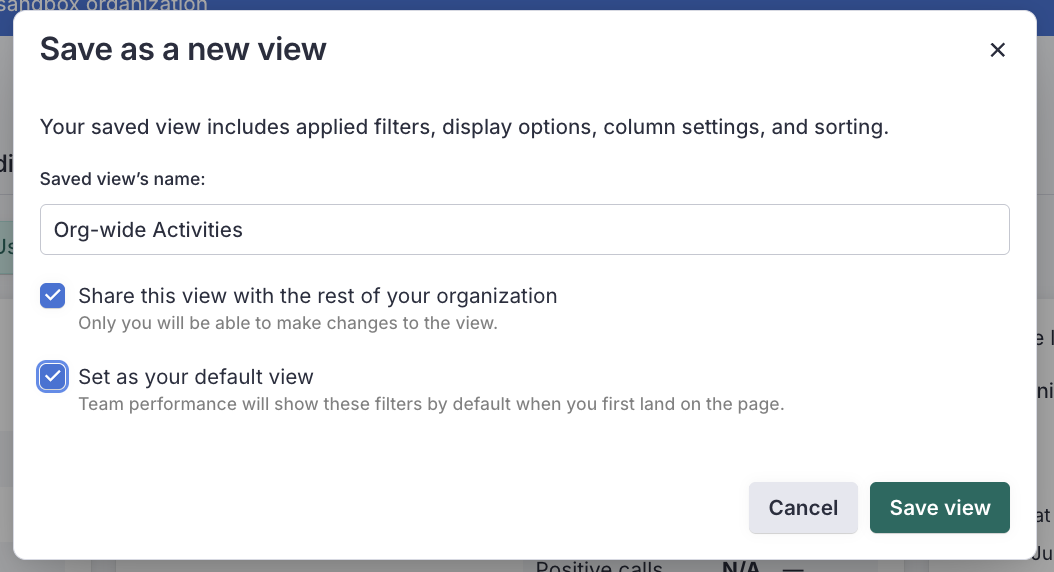
Figure 2: Share an Analytics Saved View
To edit an existing Saved View, follow these steps:
- Navigate to the report: Open Salesloft Analytics and select the report you want to edit a Saved View for.
- Select Saved Filter: Use the dropdown to select the Saved View you want to share.
- Edit View: Click the ellipses icon to the right of the view name and then click Edit View.
- Make Changes: Make any of the following changes in the edit window:
- Update title
- Share this view with the rest of your organization to make the view shareable (or remove as a shared view).
- Set view as default (or remove default)
- Save the view: Click the Save button to save the changes to the Saved View.
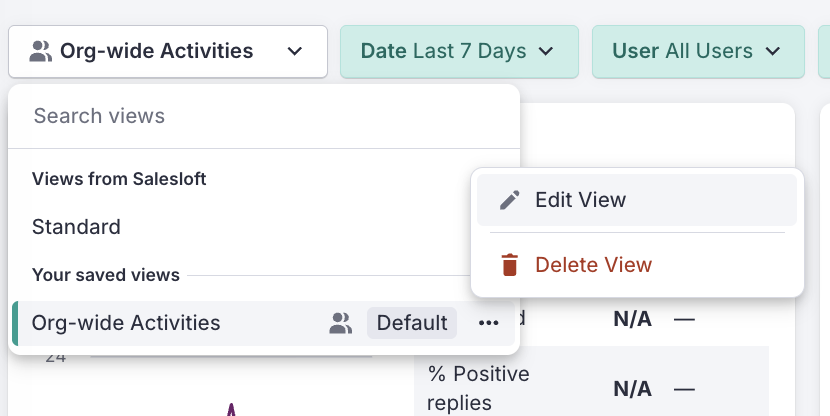
Figure 3: Edit a Saved Analytics View
Saved Views in Analytics
Custom Reports will be saved as a “Saved View” inside Analytics. You will find Saved Views in the first filter drop down inside an Analytics page.
By default, Salesloft will display the Standard View of each report. The Standard View is the "out of box" version of the report with the majority of the fields on display and none of the filters in place.
If you click the name of the saved view, a dropdown menu will appear with all of your available reports. The reports will be separated into the following sections:
- Standard View
- Custom Views
Any time you adjust Analytics Filters, or table columns you can create a new or custom view.
Figure 4: Standard and Custom Saved Views in Analytics